Indian IT Sector in Trouble? Decoding Weak Earnings and Global Slowdown


Key Takeaways
• Weak earnings from major IT companies reflect slowing global demand and cautious client spending.
• US and Europe slowdown is directly impacting Indian IT exports and deal pipelines.
• Margin pressure, lower hiring, and delayed projects are key concerns for the sector.
• Long term growth drivers like digital transformation and AI remain intact.
• Investors should focus on fundamentals, valuations, and long term opportunities.
Indian IT Sector in Trouble? Decoding Weak Earnings and Global Slowdown
The Indian IT sector has long been a backbone of the country’s export economy and a favorite among equity investors. Companies like Infosys, TCS, and HCLTech have consistently delivered strong growth over the years.
However, recent earnings reports have raised concerns. Revenue growth is slowing, deal wins are becoming cautious, and management commentary across companies sounds more conservative than before.
This has led to a key question in the minds of investors: Is the Indian IT sector in trouble, or is this just a temporary slowdown?
To understand the situation, it is important to look at both global and domestic factors shaping the sector.
Why Are Indian IT Companies Reporting Weak Earnings?
The recent weakness in earnings is not due to one single factor. It is the result of multiple global and sector specific challenges coming together.
Slowing Global Demand
Indian IT companies generate a large portion of their revenue from overseas markets, especially the United States and Europe.
With fears of recession and economic uncertainty in these regions, companies are cutting back on discretionary spending.
IT services such as digital transformation projects, cloud migration, and consulting are often among the first expenses to be postponed during uncertain times.
This has directly impacted revenue growth for Indian IT firms.
Delay in Decision Making
Clients are not necessarily cancelling projects, but they are taking longer to finalize deals.
Large contracts are being split into smaller phases. Budget approvals are delayed. This cautious approach affects deal pipelines and short term growth visibility.
Pricing and Margin Pressure
Another challenge is margin pressure.
Wage costs have increased over the past few years due to high demand for tech talent. At the same time, clients are negotiating harder on pricing.
This combination puts pressure on operating margins.
Real World Example from Recent Earnings
Recent quarterly results from major IT firms highlight these trends.
Some companies reported:
• Lower than expected revenue growth
• Weak guidance for upcoming quarters
• Reduced hiring plans
• Focus on cost optimization
Management commentary across firms suggests that while demand remains, it is not as strong or aggressive as it was during the post pandemic digital boom.
How Global Slowdown Impacts Indian IT
The Indian IT sector is closely linked to global economic cycles.
When economies like the US slow down, businesses reduce spending. Since IT services are often linked to business expansion and innovation, demand naturally softens.
Exposure to US Market
A significant share of revenue for Indian IT companies comes from North America.
Any slowdown in sectors like banking, technology, or retail in the US can impact outsourcing demand.
Europe Adds to Uncertainty
Europe is also facing economic challenges, including inflation and energy related concerns.
This further weakens demand for IT services.
Impact on Indian Stock Markets
The IT sector holds a significant weight in Indian indices like Nifty 50 and Sensex.
When IT stocks underperform, it can drag overall market performance.
Valuation Correction
During the pandemic, IT stocks saw strong rallies due to high demand for digital services.
Now, with growth slowing, valuations are being reassessed.
This has led to corrections in IT stocks.
Sector Rotation
Investors often shift funds from underperforming sectors to those with better growth prospects.
For example, during periods of IT weakness, sectors like banking, capital goods, or energy may attract more attention.
Is This a Structural Problem or a Temporary Phase?
This is one of the most important questions for investors.
Short Term Challenges
Current challenges such as delayed deals, cautious spending, and global slowdown are largely cyclical.
They are linked to economic conditions rather than a permanent decline in demand.
Long Term Growth Drivers Remain Strong
Despite short term weakness, the long term outlook for the Indian IT sector remains positive.
Key drivers include:
• Digital transformation across industries
• Adoption of cloud computing
• Growth in artificial intelligence and automation
• Increasing demand for cybersecurity
Businesses worldwide continue to rely on technology to improve efficiency and stay competitive.
Indian IT companies have strong capabilities in delivering these services.
What Should Investors Do Now?
Market uncertainty can create confusion, but it also presents opportunities.
Focus on Fundamentals
Investors should focus on companies with strong balance sheets, consistent cash flows, and diversified client bases.
Avoid Panic Selling
Short term volatility should not drive long term investment decisions.
Quality companies often recover when economic conditions improve.
Monitor Global Indicators
Keep an eye on global economic trends such as US GDP growth, interest rates, and corporate spending.
These indicators provide clues about future demand for IT services.
Role of Research and Smart Investing Platforms
Navigating sectoral slowdowns requires access to reliable data, research, and insights.
Platforms like Swastika Investmart, a SEBI registered brokerage, offer investors tools to analyze market trends, track portfolios, and make informed decisions.
With a focus on technology driven investing and investor education, Swastika Investmart helps individuals understand both risks and opportunities in evolving market conditions.
Having access to professional research and responsive customer support can make a meaningful difference, especially during uncertain phases.
Frequently Asked Questions
Why is the Indian IT sector facing a slowdown?
The slowdown is mainly due to reduced global demand, cautious client spending, and delays in project approvals, especially in the US and Europe.
Are IT companies in India still a good long term investment?
Yes, the long term growth drivers such as digital transformation, AI adoption, and cloud computing remain strong.
How does global recession impact Indian IT companies?
A global slowdown reduces corporate spending on IT services, which directly affects revenue growth for Indian IT firms.
Should investors avoid IT stocks right now?
Not necessarily. Investors should focus on fundamentally strong companies and take a long term view rather than reacting to short term volatility.
Which sectors benefit when IT underperforms?
Sectors like banking, infrastructure, and energy often attract investor interest during IT sector slowdowns.
Conclusion
The recent weakness in the Indian IT sector reflects global economic realities rather than a structural decline.
While earnings may remain under pressure in the short term, the sector’s long term growth story remains intact.
For investors, this phase is less about fear and more about understanding the cycle. Market corrections often create opportunities to invest in quality businesses at better valuations.
Staying informed, disciplined, and research driven is key to navigating such phases.
If you are looking for expert insights, advanced trading tools, and a reliable SEBI registered platform, consider starting your investment journey with Swastika Investmart.
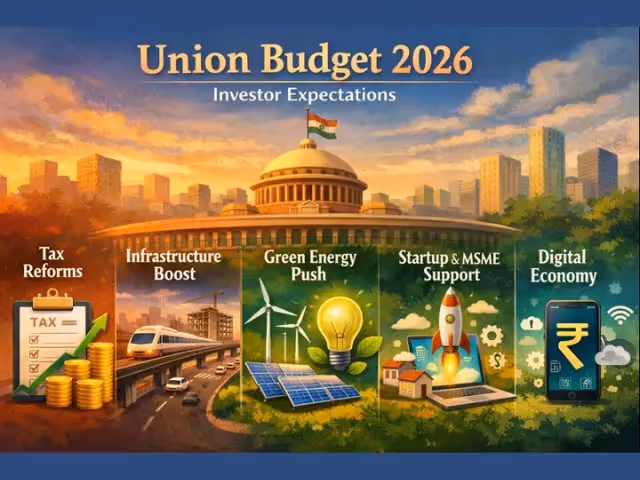
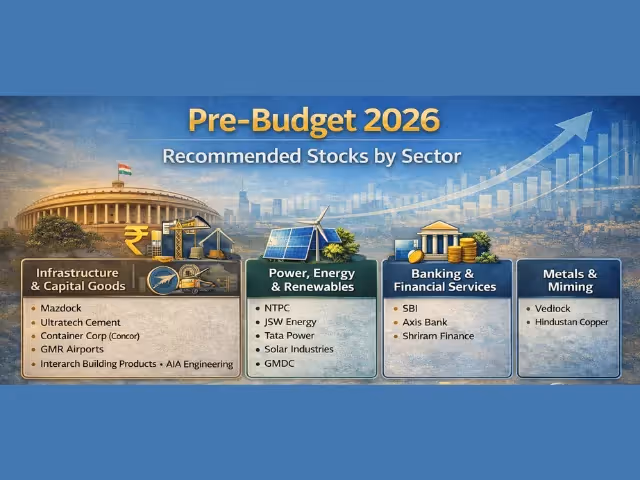
Big Budget


.avif)
.avif)
.avif)
.avif)
.avif)


.avif)
.avif)
.avif)
.avif)
Latest Articles

US-Iran Conflict Update: Is the War Nearing an End?


Key Takeaways
- Fresh talks between the US and Iran signal possible de-escalation
- Naval blockade disrupted oil flows but crude prices softened
- Global markets reacted positively to hopes of resolution
- India could benefit from stable or lower oil prices
- Investors should track geopolitics alongside macro indicators
Introduction
Geopolitical tensions often create uncertainty in financial markets, and the recent developments between the United States and Iran are no exception. However, the latest US-Iran conflict update suggests that the situation may be moving towards a resolution.
Statements from Donald Trump indicate that fresh talks could take place soon, raising hopes that the conflict may be nearing its end. At the same time, military actions such as the naval blockade of Iranian ports have added complexity to the situation.
For investors, the key question is not just about the conflict itself but its impact on oil prices, global markets, and the Indian economy.
What’s Happening Right Now
Recent developments point to a mixed but evolving situation.
Key Highlights
- The US has implemented a naval blockade targeting Iranian ports
- Several oil tankers reportedly altered routes or halted movement
- Talks between US and Iranian officials could resume shortly
- US officials have hinted that the conflict may be close to resolution
While military pressure remains, diplomatic signals are becoming stronger.
Oil Markets: The Surprising Reaction
Typically, geopolitical conflicts in the Middle East push oil prices higher. However, the recent trend has been different.
What We Are Seeing
- Brent crude prices have remained stable or slightly lower
- Markets are pricing in the possibility of de-escalation
- Supply disruptions have been limited so far
Why Oil Prices Are Falling
- Expectations of a peace agreement
- Adequate global supply buffers
- Controlled escalation rather than full-scale conflict
👉 This shows how market expectations often matter more than current events
Global Markets Reaction
Interestingly, equity markets have shown resilience despite geopolitical tensions.
📊 Key Trends
- US markets closed higher
- Asian markets moved upward
- Risk sentiment improved on hopes of negotiations
The Market Logic
Markets tend to look ahead. If investors believe that the conflict will not escalate further, risk appetite improves.
👉 This is why markets can rise even when headlines appear negative
Impact on Indian Markets
For India, developments in the Middle East are extremely important due to its dependence on oil imports.
🛢️ 1. Oil Prices and Inflation
Lower or stable oil prices can:
- Reduce inflationary pressure
- Improve fiscal balance
- Support currency stability
📉 2. RBI Policy Outlook
If inflation remains under control, the Reserve Bank of India may have more flexibility in its policy stance.
📊 3. Sectoral Impact
- Aviation and logistics benefit from lower fuel costs
- Oil marketing companies may see margin changes
- FMCG companies benefit from lower input costs
The Bigger Picture: Geopolitics and Markets
Geopolitical events like the US-Iran conflict highlight an important reality.
Markets are influenced not just by events, but by expectations.
Historical Context
In previous global conflicts, markets have often:
- Fallen sharply during uncertainty
- Recovered quickly once clarity emerges
Current Situation
The combination of:
- Military pressure
- Diplomatic engagement
creates a scenario where markets are cautiously optimistic.
What Should Investors Do
In times of geopolitical uncertainty, disciplined investing becomes even more important.
🧠 1. Avoid Panic Reactions
Short-term news should not drive long-term decisions
📊 2. Track Key Indicators
- Crude oil prices
- Inflation data
- Central bank commentary
📉 3. Stay Diversified
A balanced portfolio can help manage volatility
⏳ 4. Focus on Fundamentals
Strong companies tend to recover faster from global shocks
Risks That Still Remain
Despite positive signals, risks have not disappeared.
⚠️ Key Concerns
- Escalation of military conflict
- Prolonged blockade affecting global trade
- Involvement of other global powers
👉 These factors can quickly change market sentiment
A Practical Takeaway
For investors, the US-Iran conflict is a reminder that global events can have local market impacts.
However, it also reinforces that:
- Markets are forward-looking
- Panic is often temporary
- Opportunities arise during uncertainty
FAQs
1. Is the US-Iran war really ending?
There are signs of de-escalation, but the situation remains fluid and depends on ongoing negotiations.
2. Why are oil prices not rising despite tensions?
Markets expect a resolution and believe supply disruptions will be limited.
3. How does this affect Indian markets?
Lower oil prices can support economic stability and improve market sentiment.
4. Should investors be worried about geopolitical risks?
Investors should stay aware but avoid making emotional decisions based on short-term events.
5. What should investors do in such situations?
Focus on diversification, track macro indicators, and stay invested for the long term.
Conclusion
The latest US-Iran conflict update suggests that while tensions remain, the possibility of resolution is increasing. Markets have responded positively to this outlook, with oil prices stabilizing and equities showing resilience.
For Indian investors, the key takeaway is clear: global events matter, but disciplined investing matters more.
At Swastika Investmart, we provide insight-driven research, advanced trading platforms, and continuous investor education to help you navigate such complex market environments with confidence.

₹519 Crore Order Boost: Why HG Infra Stock Is in Focus
Key Takeaways
- Bajaj Group is entering healthcare with an initial ₹2,000 to ₹2,500 crore investment
- The new platform focuses on a full “continuum of care” model
- Integration with insurance could be a key competitive advantage
- Healthcare offers long-term growth potential for large conglomerates
- Execution will be critical to determine success in this capital-intensive sector
TL;DR
- HG Infra Engineering Ltd secured a ₹519 crore railway infrastructure order
- Stock surged sharply and extended its recent rally
- Strong order inflow improves revenue visibility
- Infrastructure sector tailwinds remain supportive
- Execution and margins will be key for sustained growth
Introduction
Infrastructure stocks have once again come into the spotlight, and HG Infra Engineering Ltd is leading the charge. The company’s recent ₹519 crore order win has triggered a sharp rally in its share price, catching the attention of both traders and long-term investors.
But beyond the immediate price movement, the bigger question is whether this development strengthens the company’s long-term growth story.
The Order Win: What Exactly Happened
HG Infra Engineering recently secured a contract worth ₹519.33 crore from Mirzapur Thermal Energy Limited.
Scope of the Project
- Civil works including earthwork and bridges
- Construction of station buildings
- Permanent way works for railway infrastructure
- Associated with a 2x800 MW thermal power project in Uttar Pradesh
The project is expected to be completed within 18 months, adding to the company’s execution pipeline.
Why the Market Reacted Strongly
The stock saw a sharp jump following the announcement. This reaction was not just about the order size but also about what it signals.
📊 1. Strong Order Book Visibility
For infrastructure companies, future revenue depends heavily on order inflow.
👉 A steady stream of contracts ensures:
- Predictable cash flows
- Better revenue visibility
- Improved investor confidence
📈 2. Consistent Execution Track Record
HG Infra has built a reputation for timely project execution. This gives the market confidence that new orders will translate into actual revenue.
🔄 3. Momentum from Previous Orders
Just a month earlier, the company secured another major order worth ₹401 crore in Madhya Pradesh.
👉 This indicates:
- Strong bidding capabilities
- Healthy pipeline of opportunities
Broader Sector Tailwinds
The infrastructure sector in India is currently supported by strong structural drivers.
🚧 Government Push
The government continues to invest heavily in:
- Roads and highways
- Railways
- Power infrastructure
Initiatives under programs like National Infrastructure Pipeline are driving long-term demand.
🚆 Railway Infrastructure Focus
Railway modernization and expansion have become key priorities.
Companies like HG Infra Engineering Ltd are well-positioned to benefit from:
- Increased capex
- Electrification projects
- Dedicated freight corridors
Financial Implications of the Order
While ₹519 crore may seem modest compared to large EPC contracts, its importance lies in cumulative impact.
📊 Revenue Contribution
- Adds to the company’s existing order book
- Strengthens revenue pipeline for the next 1 to 2 years
💰 Margin Considerations
Execution quality will determine:
- Operating margins
- Profitability
- Cash flow generation
Stock Performance Snapshot
The stock has been on a strong upward trajectory, extending gains over multiple sessions.
Key Observations
- Sharp rally post order announcement
- Recovery from recent lows
- Still below its previous 52-week high
👉 This suggests that while momentum is strong, the stock is not in an overheated zone yet.
Risks Investors Should Watch
Despite positive developments, infrastructure stocks come with inherent risks.
⚠️ 1. Execution Risk
Delays in project completion can impact revenue recognition
⚠️ 2. Cost Overruns
Rising raw material costs can affect margins
⚠️ 3. Working Capital Pressure
Infrastructure projects often require high upfront investment
⚠️ 4. Order Concentration
Dependence on a few large contracts can increase risk
What This Means for Investors
The recent order win reinforces the company’s position as a strong player in the infrastructure space.
🧠 Short-Term View
- Positive momentum driven by news flow
- Traders may continue to track price action
📊 Long-Term View
- Strong order pipeline supports growth visibility
- Sector tailwinds remain favorable
- Execution will be the key differentiator
A Practical Perspective
In the infrastructure space, success is not defined by one order but by consistent order inflow and execution.
HG Infra’s recent performance suggests:
- Improving business momentum
- Strong positioning in railway and power-linked infrastructure
However, investors should avoid chasing momentum blindly and focus on fundamentals.
FAQs
1. Why did HG Infra’s stock rise sharply?
The stock surged after the company secured a ₹519 crore order, improving its order book visibility.
2. What is the significance of this order?
It strengthens revenue visibility and reflects strong execution and bidding capabilities.
3. Is the infrastructure sector a good investment theme?
Yes, due to government spending and long-term growth prospects, but it comes with execution risks.
4. What risks should investors consider?
Execution delays, cost overruns, and working capital requirements are key risks.
5. Is HG Infra a long-term investment opportunity?
It has potential, but investors should track order flow, margins, and execution performance.
Conclusion
The ₹519 crore order win has once again put HG Infra Engineering Ltd in the spotlight. While the stock’s sharp rally reflects positive sentiment, the real story lies in sustained execution and consistent order inflow.
For investors, this is a reminder that infrastructure plays are long-term stories shaped by discipline and delivery, not just short-term news triggers.
At Swastika Investmart, we help investors decode such market movements with in-depth research, advanced tools, and continuous guidance so that you can make informed decisions.

From Finance to Healthcare: Inside Bajaj’s Big Strategic Shift
Key Takeaways
- Bajaj Group is entering healthcare with an initial ₹2,000 to ₹2,500 crore investment
- The new platform focuses on a full “continuum of care” model
- Integration with insurance could be a key competitive advantage
- Healthcare offers long-term growth potential for large conglomerates
- Execution will be critical to determine success in this capital-intensive sector
Introduction
The Indian healthcare sector is witnessing a major shift as large corporate groups begin to see it as the next big growth opportunity. One of the most notable recent moves comes from the Bajaj Group, which is stepping into healthcare with a long-term vision and significant capital commitment.
Traditionally known for its strength in financial services, the group is now building a healthcare platform from the ground up. This is not just a diversification move. It is a calculated strategic shift aimed at tapping into one of India’s fastest-growing sectors.
The Big Announcement: What Bajaj Is Building
The group has announced the creation of a new entity, Bajaj Integrated Health Systems, with an initial investment of ₹2,000 to ₹2,500 crore. Over time, this investment could scale up to ₹6,000 to ₹7,000 crore.
Key Highlights of the Plan
- A pan-India healthcare network over the next 10 to 15 years
- Multi-layered model including hospitals, clinics, day-care centres, and home care
- Initial rollout starting in Pune, followed by expansion to Mumbai
This clearly indicates a platform-building approach, rather than a one-off investment.
The Core Strategy: Continuum of Care
What sets Bajaj apart is its decision to move away from the traditional hospital-centric model.
What Is “Continuum of Care”?
Instead of focusing only on large hospitals, the model aims to provide healthcare across multiple levels:
- Primary care through clinics
- Secondary care through day-care centres
- Tertiary care through hospitals
- Post-treatment support via home care
Why This Matters
In India, a large portion of healthcare needs do not require hospitalization.
👉 Around 70 to 80 percent of cases can be managed outside hospitals
This approach can:
- Reduce treatment costs
- Improve patient convenience
- Increase system efficiency
It shifts the focus from maximizing hospital occupancy to optimizing patient outcomes.
The Strategic Edge: Integration with Insurance
One of Bajaj’s biggest advantages lies in its existing financial ecosystem, particularly its insurance business.
Through integration with Bajaj Allianz General Insurance, the group can create a connected healthcare ecosystem.
Potential Benefits
- Better cost control through integrated services
- Higher patient inflow via insurance networks
- Development of customized outpatient-focused insurance products
This combination of healthcare delivery and insurance can create a powerful competitive moat over time.
Why Healthcare, Why Now
India’s healthcare sector presents a compelling opportunity.
Structural Drivers
- Rising urbanization
- Increasing lifestyle diseases
- Growing middle-class income
- Higher health awareness post-pandemic
Despite these factors, healthcare infrastructure in India remains underpenetrated.
Market Opportunity
For a large conglomerate like the Bajaj Group, healthcare offers:
- Long-term stable growth
- Lower cyclicality compared to sectors like auto or finance
- Opportunity to build a scalable, future-ready platform
Market Impact: What This Means for Investors
Bajaj’s entry into healthcare is not just a corporate move. It has broader implications for the market.
📊 1. Increased Competition in Healthcare
Existing hospital chains and healthcare providers may face increased competition, especially in integrated care models.
📈 2. Valuation Re-Rating Potential
If executed well, the healthcare vertical could:
- Unlock new revenue streams
- Improve long-term valuation multiples
⚠️ 3. Execution Risk
Greenfield projects come with challenges:
- High capital expenditure
- Long gestation period
- Operational complexities
Investors will need to track execution closely.
Challenges Ahead
While the opportunity is large, the path is not easy.
Key Risks
- Building brand trust in healthcare
- Attracting and retaining quality doctors
- Managing costs while scaling operations
- Navigating regulatory requirements
Healthcare is a sector where execution matters more than intent.
A Real-World Perspective
We have seen other corporate groups enter healthcare with varying degrees of success. The key differentiator has always been:
- Integration
- Scale
- Patient trust
Bajaj’s approach of combining insurance and healthcare delivery could address these challenges effectively, but the results will unfold over time.
What Should Investors Watch
For investors tracking this development, a few key indicators will be important:
- Speed of expansion across cities
- Partnerships with medical professionals
- Financial performance of the healthcare vertical
- Integration with insurance services
These factors will determine whether this initiative becomes a core business driver.
FAQs
1. Why is Bajaj entering the healthcare sector?
The group sees healthcare as a long-term growth opportunity driven by rising demand and underpenetration in India.
2. What is the “continuum of care” model?
It is an integrated healthcare approach that includes clinics, hospitals, day-care, and home care services.
3. How will insurance integration help Bajaj?
It can improve patient inflow, reduce costs, and enable customized healthcare solutions.
4. What are the risks in this strategy?
High capital investment, execution challenges, and long gestation periods are key risks.
5. Is this good for investors?
It has long-term potential, but investors should monitor execution closely before forming conclusions.
Conclusion
Bajaj’s entry into healthcare marks a significant strategic shift from its traditional focus on financial services. By building an integrated, patient-centric ecosystem, the group is positioning itself for long-term growth in a sector with immense potential.
However, success will depend on execution, scalability, and the ability to build trust in a highly sensitive industry.
At Swastika Investmart, we help investors stay ahead by providing research-driven insights, advanced tools, and continuous investor education. Understanding such strategic shifts is crucial for making informed investment decisions.
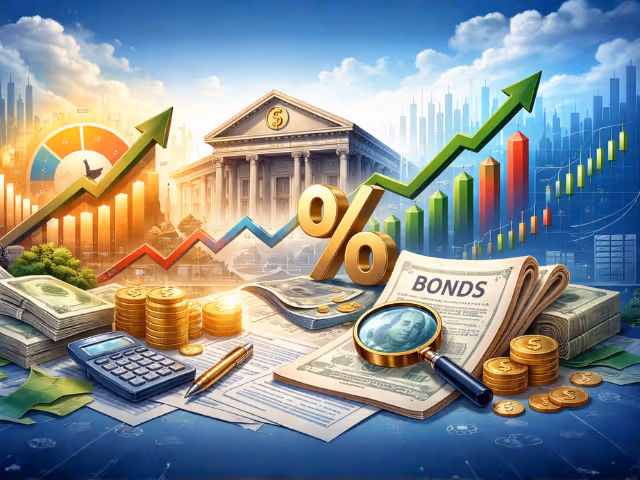
From Inflation to Bond Yields: Understanding Interest Rate Cycles & Market Impact.
Key Takeaways
- Inflation directly influences interest rate decisions by central banks
- Rising inflation pushes bond yields higher and impacts equity valuations
- Interest rate cycles affect different sectors in different ways
- Bond markets react faster than equities to macro changes
- Smart asset allocation helps investors navigate these cycles
Introduction
If you have ever wondered why markets suddenly turn volatile or why borrowing costs change, the answer often lies in three interconnected factors: inflation, bond yields, and interest rate cycles.
At the center of this ecosystem is the Reserve Bank of India, which adjusts policy rates to balance growth and inflation. These decisions ripple through bond markets, equity markets, and ultimately your investment portfolio.
Understanding this chain reaction is essential for investors who want to stay ahead rather than react late.
What is Inflation and Why It Matters
Inflation refers to the rise in prices of goods and services over time. While moderate inflation is a sign of healthy demand, excessive inflation can disrupt economic stability.
Real-World Example
When fuel prices increase, transportation costs go up. This affects everything from groceries to manufacturing. As a result, consumers end up paying more across categories.
👉 This is how inflation spreads across the economy
How Inflation Impacts Interest Rates
Central banks use interest rates as a tool to control inflation.
When Inflation Rises
- Central bank increases interest rates
- Borrowing becomes expensive
- Demand slows down
When Inflation Falls
- Central bank cuts interest rates
- Borrowing becomes cheaper
- Consumption and investment rise
The Policy Role
The Reserve Bank of India closely tracks inflation trends before making policy decisions. Its primary goal is to maintain price stability while supporting growth.
Understanding Interest Rate Cycles
Interest rate cycles move in phases depending on economic conditions.
📉 Easing Phase
- Rates are reduced
- Liquidity increases
- Equity markets tend to perform well
📈 Tightening Phase
- Rates are increased
- Liquidity tightens
- Market valuations may compress
⏸️ Pause Phase
- Rates remain unchanged
- Markets turn data-dependent
- Volatility can remain high
Bond Yields: The Missing Link
Bond yields are often the first indicators of changing economic conditions.
What Are Bond Yields?
Bond yield is the return an investor earns on a bond.
Relationship Between Inflation and Bond Yields
- Rising inflation leads to higher bond yields
- Falling inflation leads to lower bond yields
👉 Key Rule:
When yields rise, bond prices fall, and vice versa
Why Bond Markets React First
Bond investors closely monitor:
- Inflation data
- Interest rate expectations
- Fiscal policies
👉 This makes bond markets more sensitive and quicker to react than equity markets
Impact on Equity Markets
Equity markets respond differently depending on the stage of the cycle.
🔴 High Inflation and Rising Rates
- Valuations come under pressure
- Growth stocks may correct
- Cost-sensitive sectors struggle
🟢 Stable Inflation and Lower Rates
- Earnings visibility improves
- Liquidity supports valuations
- Market sentiment turns positive
Sector-Wise Impact in India
🚀 Beneficiaries
- Banking sector during rising rates
- Commodities and energy during inflation spikes
⚠️ Challenged Sectors
- Real estate and auto due to higher borrowing costs
- FMCG due to input cost pressures
Practical Example from Indian Markets
During periods of rising inflation in India, bond yields have historically moved higher, leading to cautious equity market behavior. Rate-sensitive sectors such as real estate and auto often underperform, while banks may benefit from improved margins.
This pattern reinforces the importance of tracking macro indicators rather than focusing only on stock-specific news.
How Investors Should Respond
Understanding macro cycles can significantly improve investment decisions.
🧠 1. Focus on Asset Allocation
Balance between equity, debt, and other assets
📊 2. Track Bond Yields
They often signal upcoming changes in interest rates
📉 3. Adjust Sector Exposure
Reduce exposure to rate-sensitive sectors during tightening phases
⏳ 4. Stay Long-Term Focused
Short-term volatility is part of market cycles
Why This Matters More Today
With global uncertainties, commodity price fluctuations, and changing inflation trends, interest rate cycles have become more dynamic.
For Indian investors, this means:
- More frequent market shifts
- Greater importance of macro awareness
- Need for disciplined investing
FAQs
1. What is the relationship between inflation and bond yields?
Rising inflation usually leads to higher bond yields, while falling inflation leads to lower yields.
2. How do interest rate cycles affect stock markets?
Rate hikes can pressure valuations, while rate cuts generally support market growth.
3. Why do bond markets react faster than equity markets?
Bond markets are more sensitive to macroeconomic changes like inflation and interest rates.
4. Which sectors perform well during rising interest rates?
Banking and financial sectors may benefit, while rate-sensitive sectors may struggle.
5. How should investors use this information?
Investors should track macro indicators, diversify their portfolios, and adjust strategies based on economic cycles.
Conclusion
From inflation to bond yields and interest rate cycles, the connection is clear. These factors shape market direction and influence investment outcomes more than short-term news flows.
For investors, the goal is not to predict every move but to understand the cycle and position accordingly.
At Swastika Investmart, we combine deep market research, advanced tools, and investor education to help you navigate complex market environments with confidence.
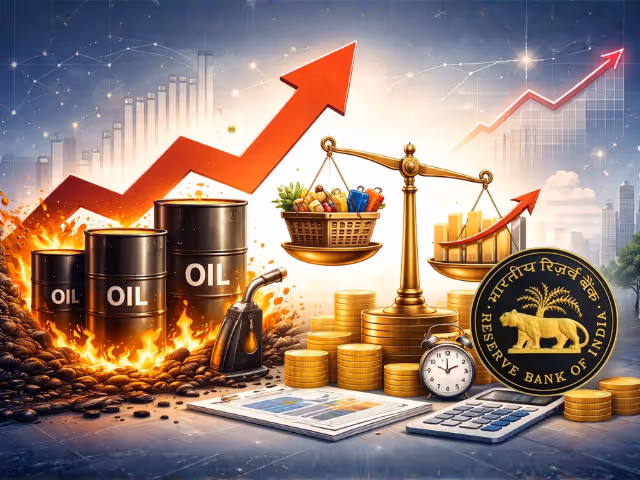
Why Rising Oil Prices and Inflation May Force RBI to Pause Rate Cuts
Key Takeaways
- Rising crude oil prices are pushing inflation risks higher
- Higher inflation limits the ability of RBI to cut interest rates
- Rate pause can impact equity markets and borrowing costs
- Oil-sensitive sectors may face pressure in the short term
- Investors should focus on diversification and quality stocks
Introduction
The global economic environment is once again turning uncertain, with crude oil prices inching higher and inflation concerns resurfacing. For India, this combination creates a challenging situation for policymakers, especially the Reserve Bank of India.
At a time when markets were expecting further rate cuts to support growth, rising inflationary pressures may force the central bank to take a pause. This shift has important implications for investors, borrowers, and the overall market direction.
The Link Between Oil Prices and Inflation
India is heavily dependent on crude oil imports, which makes it highly sensitive to global price movements.
How Rising Oil Prices Impact Inflation
- Higher fuel costs increase transportation expenses
- Logistics costs rise across industries
- Raw material prices move up
- End consumers face higher prices
👉 This leads to cost-push inflation, where rising input costs push overall prices higher
Real-World Context
Whenever crude oil prices spike globally, India often experiences a rise in retail fuel prices. This directly affects household budgets and reduces disposable income, slowing consumption demand.
Why RBI May Pause Rate Cuts
Central banks balance two key objectives:
- Supporting economic growth
- Controlling inflation
When inflation rises, controlling it becomes the priority.
The Policy Dilemma
- Rate cuts help boost growth by making loans cheaper
- But they can also increase inflation by boosting demand
👉 In a high inflation environment, cutting rates becomes risky
Current Scenario
- Rising oil prices are adding inflationary pressure
- Global uncertainties are increasing volatility
- Currency fluctuations can further amplify imported inflation
👉 This leaves the Reserve Bank of India with limited room to ease monetary policy
Impact on Indian Markets
A pause in rate cuts can influence multiple segments of the market.
📊 1. Equity Markets
- Rate-sensitive sectors may underperform
- Valuations may remain under pressure
- Market sentiment could turn cautious
🏦 2. Banking and NBFC Sector
- Loan growth may stabilize rather than accelerate
- Margins could remain steady but not expand significantly
🏠 3. Realty and Auto
- Higher borrowing costs may impact demand
- Consumer financing becomes less attractive
🛢️ 4. Energy Sector
- Upstream companies may benefit from higher oil prices
- Downstream companies may face margin pressure
Bond Market Perspective
Bond markets react quickly to inflation and interest rate expectations.
What Happens When Inflation Rises
- Bond yields tend to move higher
- Bond prices fall
- Long-duration bonds become less attractive
👉 Investors may prefer shorter-duration fixed income instruments during such phases
What Should Investors Do?
Market conditions like these require a balanced and disciplined approach.
🧠 1. Focus on Asset Allocation
Maintain a mix of equity, debt, and other asset classes
📉 2. Avoid Overexposure to Rate-Sensitive Stocks
Sectors like real estate and auto may face short-term pressure
📊 3. Look for Quality Businesses
Companies with:
- Strong pricing power
- Stable demand
- Healthy balance sheets
tend to perform better during inflationary periods
⏳ 4. Stay Invested for the Long Term
Short-term volatility should not derail long-term investment goals
A Broader Perspective
Historically, periods of rising oil prices and inflation have led to cautious monetary policy globally. India is no exception.
For example, during earlier commodity cycles, central banks often paused or delayed rate cuts until inflation showed signs of cooling. This pattern reinforces the importance of monitoring macroeconomic indicators.
Key Indicators to Watch
- Crude oil price trends
- CPI inflation data
- RBI policy statements
- Global economic developments
Tracking these indicators can provide early signals of policy direction.
FAQs
1. Why do rising oil prices impact inflation?
Because oil affects transportation and production costs, which increases the overall price of goods and services.
2. Why might RBI pause rate cuts?
To control inflation and maintain economic stability, especially when price pressures are rising.
3. How does this affect stock markets?
It can lead to cautious sentiment, especially in rate-sensitive sectors, while some sectors like energy may benefit.
4. What happens to bond yields in this scenario?
Bond yields usually rise when inflation increases, leading to a fall in bond prices.
5. What should investors do during such phases?
Maintain diversification, focus on quality investments, and avoid making decisions based on short-term volatility.
Conclusion
Rising oil prices and inflation are key factors shaping the current economic landscape. While markets were hoping for continued rate cuts, the reality is that the Reserve Bank of India may need to stay cautious.
For investors, this is not a time to panic but to adapt. A well-diversified portfolio, combined with a focus on quality and long-term discipline, can help navigate such phases effectively.
At Swastika Investmart, we empower investors with research-driven insights, advanced trading tools, and strong customer support to make informed decisions in changing market conditions.

21 Hours, No Agreement: What’s Next After US-Iran Talks Collapse?
Key Takeaways
- US-Iran talks ended without a deal after 21 hours of negotiations
- Rising tensions may lead to supply risks and higher oil prices
- Global markets could see increased volatility in the near term
- Indian markets may face pressure via inflation and currency movement
- Investors should stay cautious and focus on diversified portfolios
Introduction
After nearly 21 hours of intense negotiations, the much-anticipated US-Iran talks ended without any agreement. The development has once again brought geopolitical tensions into focus, with potential ripple effects across global markets.
Statements from leaders like Donald Trump and JD Vance indicate that the situation could escalate further, with options such as restricting Iran’s oil exports being considered.
For investors, especially in India, this is not just a political headline. It is a macro event that can influence oil prices, inflation, currency, and overall market sentiment.
What Happened in the US-Iran Talks?
The talks, held in Islamabad, were aimed at reaching a breakthrough on key issues, particularly Iran’s nuclear-related commitments. However, despite prolonged discussions, both sides failed to reach common ground.
Key Highlights:
- Negotiations lasted around 21 hours
- The US presented what it called its “final and best offer”
- No agreement was reached on core demands
- Strategic pressure options, including trade and oil restrictions, are being discussed
This outcome signals a shift from diplomacy toward increased geopolitical pressure.
Why This Matters Globally
The US and Iran are critical players in the global energy ecosystem. Any disruption in their relationship can have far-reaching consequences.
1. Oil Supply Risks
Iran is a key oil exporter. Any restriction on its exports can tighten global supply.
👉 Result: Oil prices may rise sharply
2. Inflation Concerns
Higher oil prices directly impact:
- Transportation costs
- Manufacturing expenses
- Consumer prices
This can push global inflation higher, complicating central bank policies.
3. Market Volatility
Geopolitical uncertainty often leads to:
- Equity market corrections
- Flight to safe-haven assets like gold
- Currency fluctuations
Impact on Indian Markets
India, being a major oil importer, is particularly sensitive to such developments.
📊 1. Crude Oil and Inflation
- India imports more than 80 percent of its crude oil needs
- Rising oil prices can increase inflation
👉 This may limit the flexibility of the Reserve Bank of India in cutting interest rates
📉 2. Equity Market Reaction
- Sectors like aviation, paints, and logistics may face cost pressures
- Oil marketing companies could see margin volatility
- Energy producers may benefit
💱 3. Currency Pressure
- Higher oil import bills can weaken the Indian Rupee
- This may lead to foreign investor outflows in the short term
Sector-Wise Impact: Winners and Losers
🚀 Likely Beneficiaries
- Oil and gas companies
- Upstream energy players
- Commodity-linked businesses
⚠️ Under Pressure
- Aviation sector
- FMCG companies facing input cost pressure
- Auto sector due to higher fuel costs
What Should Investors Do Now?
Geopolitical events are unpredictable, but your investment strategy does not have to be.
🧠 1. Stay Diversified
Avoid overexposure to a single sector or theme
📊 2. Focus on Quality Stocks
Companies with:
- Strong balance sheets
- Pricing power
- Stable demand
tend to perform better during uncertain times
⏳ 3. Avoid Panic Decisions
Short-term volatility is common during geopolitical tensions. Long-term investors should stay disciplined
🔍 4. Track Key Indicators
- Crude oil prices
- Inflation data
- Central bank commentary
A Real-World Perspective
We have seen similar situations in the past where geopolitical tensions led to temporary spikes in oil prices and market volatility. However, markets tend to stabilize once clarity emerges.
For example, during previous Middle East tensions, oil prices surged in the short term but normalized over time as supply adjusted.
This highlights an important lesson:
Markets react quickly, but they also adapt quickly
Why This Event Is Different
What makes this situation noteworthy is the potential policy shift toward stronger economic measures, including restrictions on oil exports.
If such actions are implemented, the impact could be more prolonged compared to past events.
FAQs
1. Why did the US-Iran talks fail?
The talks failed due to disagreements on key issues, particularly around nuclear-related commitments and compliance expectations.
2. How can this impact oil prices?
Any restriction on Iran’s oil exports can reduce global supply, leading to higher crude oil prices.
3. What does this mean for Indian investors?
It may lead to higher inflation, market volatility, and sector-specific impacts, especially in oil-sensitive industries.
4. Should investors be worried?
Short-term volatility is expected, but long-term investors should stay focused on fundamentals and avoid panic selling.
5. Which sectors benefit from rising oil prices?
Energy and oil-producing companies generally benefit, while fuel-dependent sectors may face pressure.
Conclusion
The collapse of the US-Iran talks is a reminder of how quickly global events can influence financial markets. While the immediate reaction may be volatility, the long-term impact will depend on how the situation evolves.
For Indian investors, the key is to stay informed, remain disciplined, and focus on quality investments.
At Swastika Investmart, we provide research-backed insights, advanced tools, and investor education to help you navigate such uncertain environments with confidence.


.avif)
.avif)

.avif)


START YOUR INVESTMENT JOURNEY
Get personalized advice from our experts
- Dedicated RM Support
- Smooth and Fast Trading App
