
Stock Market Today (3 August 2026): Market Setup, Stocks to Watch, Q1 Results, Stocks in News & Nifty Outlook


The Indian stock market today is expected to begin on a positive note as global cues remain supportive. According to today's market setup, the Dow Jones closed higher, Dow futures are trading in the green, and GIFT Nifty indicates a firm opening for the Indian stock market today. Traders tracking the stock market NSE BSE Nifty 50, share market news live, daily market update, and current stock market trends should keep an eye on key technical levels, earnings announcements, and company-specific developments.
Today's Trader's Breakfast covers the market outlook today, stocks to watch today, stocks in news today, Q1 results today, and the important technical levels for Nifty and Bank Nifty. If you're looking for the latest stock news, market movement, share market live status, or Indian share market latest news, here's everything you need to know before the opening bell.
TRY SARTHI - YOUR AI STOCK ASSISTANT
Key Takeaways
- Global cues remain positive with Dow Jones closing higher and GIFT Nifty indicating a positive start.
- FIIs remained net buyers in the cash market.
- Nifty is expected to open near the 24,530-24,600 resistance zone.
- Concord Biotech, Chola Finance, and Ashok Leyland are the stocks to watch today.
- Several companies, including DLF, IREDA, KEI, UPL, CAMS, and PNC, will announce their Q1 earnings today.
- NCC, Maruti, PNC Infratech, and Hero Moto are among the major stocks in news today.
Watch Today's Complete Market Outlook
Stay updated with today's complete Trader's Breakfast for the latest Indian stock market news today, market outlook today, Nifty outlook, stock market update today, and expert analysis from Santosh Meena, Head of Research, Swastika Investmart.
Market Setup Today (3 August 2026)
Global Markets
Global cues remain supportive for the Indian stock market.
- US markets ended higher, with the Dow Jones gaining 276 points.
- Dow futures are trading 246 points higher.
- Asian markets are trading on a mixed note.
- GIFT Nifty: +164 points, indicating a positive opening for the share market today in India.
Cash Market
- FII: +₹277 crore
- DII: +₹2,260 crore
- Net: +₹2,537 crore
F&O Data
- Nifty PCR: 1.29 vs 1.26
- India VIX: 11.76 (-3.29%)
- Highest OI (4 Aug 2026): 24,600 CE & 24,000 PE
- Max Pain (4 Aug 2026): 24,350
FII Derivatives Position
- Future Long: +326
- Future Short: -13,173
- Call Long: +27,717
- Call Short: +35,957
- Put Long: +109,958
- Put Short: +96,913
Interpretation: FII positioning in index derivatives remains mixed to positive.
Technical Outlook
Nifty (Spot)
- Nifty is likely to open in the 24,530-24,600 resistance zone.
- Above 24,600, the next target is the 200-DMA near 24,775.
- Following the expected gap-up opening, 24,430-24,380 will act as the immediate support zone.
Bank Nifty (Spot)
- Immediate resistance: 57,800-58,200
- Above 58,200, the next hurdle is 58,600.
- Immediate supports remain at 57,300 and 56,800.
Stocks to Watch Today
Concord Biotech
Concord Biotech remains one of the stocks to watch today from a positional perspective. According to Santosh Meena, the company is expected to benefit from the positive rub-off effect of encouraging results from Divi's. Technically, the stock has witnessed a strong breakout from a bullish pattern, supported by strong quarterly numbers.
Key Levels
- Positional upside target: ₹1,700
- Important support: ₹1,333
This idea is intended for positional traders rather than day traders.
Chola Finance
Chola Finance continues to display strong technical momentum. The stock has broken out of a flag formation with healthy volumes and is trading near its all-time highs. Positive auto sales data is also expected to support financing companies such as Chola Finance.
Key Levels
- Breakout confirmation: Above ₹1,875
- Upside target: ₹2,000
- Immediate support: ₹1,800
Among today's stocks to watch for today, Chola Finance remains on the radar for momentum traders.
Ashok Leyland
Ashok Leyland is another important stock to watch today. The company reported strong auto sales numbers. Technically, the stock is forming a classical inverse head-and-shoulders pattern and is expected to open above its 200-day moving average.
Key Levels
- Upside potential: ₹200
- The stock had corrected following its previous quarterly results, but the recent sales data has improved the overall outlook.
Stocks in News Today
NCC
NCC secured three orders worth ₹1,052.71 crore during July, including ₹590.38 crore in the Buildings Division and ₹462.33 crore in the Water Division.
Maruti
Maruti Suzuki India reported total sales of 2.41 lakh units, surpassing the market estimate of 2.20 lakh units, representing 33.7% YoY growth.
PNC Infratech
PNC Infratech received a Letter of Intent from the Airports Authority of India for an EPC contract worth ₹302.44 crore for development work at Pantnagar Airport in Uttarakhand. The project is expected to be completed within 24 months.
Hero Moto
Hero Moto launched the VIDA VX2 Go electric scooter, expanding its EV portfolio with multiple charging options. The introductory price starts at ₹1.13 lakh.
Q1 Results Today
Frequently Asked Questions (FAQs)
What is the market outlook for today?
The current market setup indicates a positive opening, supported by higher US markets, positive Dow futures, and a strong GIFT Nifty.
Which are the stocks to watch today?
According to today's Trader's Breakfast, the key stocks to watch are Concord Biotech, Chola Finance, and Ashok Leyland.
Which stocks are in news today?
NCC, Maruti, PNC Infratech, and Hero Moto are among the major stocks making headlines today.
Which companies will announce Q1 results today?
Major companies scheduled to report include CAMS, DLF, IREDA, KEI, UPL, DOMS, Escorts, INOX India, Nazara, PNC, SBI Funds, and Torrent Power.
Over to You
Start your trading day with Trader's Breakfast, your daily source for the latest stock news, Indian stock market news today, market outlook today, Nifty updates, share market live updates, and stocks to watch today.
Santosh Meena, Head of Research at Swastika Investmart, shares the key technical levels, important market developments, and actionable stocks to help you stay informed before the market opens.
For more daily stock market updates, share market news, market movement, and expert insights, stay connected with Swastika Investmart.
Latest Articles

Hindustan Unilever Share Price And Q1 Results: A Retail Investor's Deep Dive


Key Takeaways
- Hindustan Unilever posted 10% revenue growth in Q1, with 5% underlying volume growth.
- Net profit fell 3% to Rs 2,673 crore, while EBITDA stood at Rs 3,947 crore with a 22.8% margin.
- Volume growth lagged expectations amid inflation and price hikes on palm oil-linked products.
- FY27 is expected to outperform FY26, supported by portfolio transformation and continued market development.
Investors watching the Hindustan Unilever share price are parsing the latest Q1 numbers, where revenue rose 10% to Rs 17,341 crore and underlying volume growth stood at 5% (below street expectations of 6-8%). The quarter marks the highest underlying sales growth in 13 quarters, with management reiterating that FY27 should be stronger than FY26 and that growth will remain volume-led. The board approved the results on July 28, as the company navigates inflationary pressures and pricing actions across categories.
Hindustan Unilever Share Price And Q1 Results: A Financial Breakdown
The numbers show a mix: revenue rose 10% YoY to Rs 17,341 crore, with underlying volume growth of 5% (vs Street expectations of 6-8%). Net profit declined 3% YoY to Rs 2,673 crore, while EBITDA stood at Rs 3,947 crore and EBITDA margin recorded 22.8%, broadly in line with estimates. Home Care delivered double-digit growth, while Personal Care grew more modestly at 4% underlying; segment revenue rose 3% YoY to Rs 2,624 crore.
In terms of price dynamics, Hindustan Unilever earnings were supported by portfolio actions but faced inflationary pressures especially in commodities. Price increases, notably in categories affected by higher input costs such as palm oil, weighed on demand in some segments. Also, price actions were observed in Dove Shampoo (nearly 10% hike) and Rin products (up to 8% since March 4), underscoring the sensitivity of discretionary segments to price changes.
The board approved the results on July 28, and management remains constructive on FY27, expecting stronger performance than FY26 driven by portfolio transformation, stable demand and continued investments in market development.
Table: Key Q1 2027 Metrics
| Metric | Value |
|---|---|
| Revenue (Q1, YoY) | Rs 17,341 crore (+10%) |
| Net Profit | Rs 2,673 crore (-3%) |
| EBITDA | Rs 3,947 crore; Margin 22.8% |
| Underlying Volume Growth | 5% (vs Street 6-8%) |
| Home Care Revenue | Rs 2,624 crore; +3% YoY |
| Personal Care Growth | 4% underlying sales growth |
| Segment Revenue Growth | 3% YoY |
Hindustan Unilever stock watchers will want to consider how the price and volume mix might affect the Hindustan Unilever share price in coming weeks. The company remains constructive on FY27, pointing to portfolio transformation, stable demand and sustained investments in market development to support growth. The results reflect a careful balance between pricing power and volume expansion, a dynamic that has dominated FMCG earnings in recent quarters.
For deeper insights, explore Swastika's Sarthi AI stock assistant for more granular stock-specific analysis that complements formal earnings data.
Hindustan Unilever Earnings: Revenue, Profit And Margin In Q1
Hindustan Unilever earnings for Q1 show revenue growth of 10% year-on-year to Rs 17,341 crore, with net profit at Rs 2,673 crore, down 3% from the prior year. EBITDA was Rs 3,947 crore, sustaining an EBITDA margin of 22.8%, broadly in line with market expectations. These metrics capture a company balancing price-led expansion with the challenges of commodity-driven input costs.
From a profitability angle, the margin resilience helps justify the 10% top-line growth, but an earnings decline amid rising costs underscores the need for disciplined pricing power and cost management. Hindustan Unilever results confirm that even with top-line strength, margins can come under pressure when input costs rise faster than selling prices. The board's approval on July 28 affirms management's confidence in the trajectory for FY27.
Hindustan Unilever stock has to digest these earnings dynamics, especially as investors compare with the 13-quarter high underlying sales growth framework. The ability to translate volume-led growth into sustainable margins will likely be a key driver for the Hindustan Unilever share price in the near term.
Note: Hindustan Unilever results have indicated a favorable trend in Home Care and a more modest performance in Personal Care, underscoring the importance of segment mix on future margins in Hindustan Unilever earnings.


Hindustan Unilever Results: Volume Growth, Pricing Pressure, And Input Costs
Underlying volume growth came in at 5% in Q1, below the Street's 6-8% expected range. Management described demand as stable but the quarter-on-quarter volume growth streak was broken, signaling a possible moderation in the pace of volume-led growth. Inflationary pressures persist, particularly in commodities, and price increases–especially in categories impacted by higher input costs such as palm oil–have weighed on demand in some segments.
Personal Care, for instance, posted 4% underlying sales growth, while Home Care delivered double-digit growth, pointing to the uneven consumer recovery across portfolios. The segment revenue rose 3% YoY to Rs 2,624 crore, underscoring a mixed, price-sensitive demand environment. These dynamics imply a path for Hindustan Unilever earnings to be driven by selective pricing and higher-margin categories, while the volume growth may require continued market development investments.
HUL's strategy of portfolio transformation is designed to buoy long-term growth, but near-term earnings are sensitive to input-cost inflation. The presence of palm oil-linked cost pressures and other commodity costs increases the risk of margin compression if pricing actions lag volume recovery.
Home Care Vs Personal Care: Segment Performance In Q1
Home Care showed the stronger momentum with double-digit growth, reflecting resilient demand for cleaning and household products in a consumer environment still rebalancing post-pandemic. Personal Care, however, lagged behind with only 4% underlying sales growth. The combined segment revenue rose 3% YoY to Rs 2,624 crore, highlighting a shift where discretionary spend remains uneven across households.
This segment mix is critical for Hindustan Unilever stock strategies because a shift toward higher-margin Home Care categories could support margin resilience even as overall volume falters. The ongoing portfolio transformation, including the introduction of new variants and pricing strategies, remains central to maintaining growth momentum. The company expects FY27 to outperform FY26, supported by stable demand and ongoing investments in market development.
Outlook For FY27: Growth Path, Risks, And Catalysts
Looking ahead, Hindustan Unilever maintains that FY27 should be stronger than FY26, driven by a volume-led growth model and portfolio transformation. The outlook hinges on a balance between pricing, volume recovery, and continued investments in market development. The company highlighted stable demand and an ongoing focus on portfolio transformation as key catalysts for growth. However, the path remains sensitive to input-cost pressures and inflation in commodities, particularly for palm oil-based categories.
In terms of stock implications, the Hindustan Unilever share price may reflect the balance of stronger top-line momentum with the risk of margin compression if volumes do not recover sharply. Shareholders and prospective investors should watch for signals from further price actions, margin trends, and the pace of volume-led growth as the year unfolds. The company's results set the stage for a likely re-rating if FY27 delivers the expected outperformance, though near-term volatility could persist.
Investment Takeaways For Hindustan Unilever Stock Investors
For retail investors, the core takeaway is to monitor whether volume growth accelerates in subsequent quarters and whether pricing power remains intact as input costs stay elevated. The 10% revenue growth and 5% underlying volume growth in Q1 paint a mixed picture: topline strength is clear, but a 3% YoY dip in net profit flags margin sensitivity. The Home Care segment's double-digit growth and Personal Care's 4% growth imply that the portfolio can navigate a broader recovery.
With the Hindustan Unilever share price in focus, consider the balance of growth vs margins when evaluating the stock. If you need more granular stock-specific insights, explore Swastika's Sarthi AI stock assistant for deeper analysis before making a decision. Swastika's Sarthi AI stock assistant.
Related Reads
- Hindustan Unilever Share Price: Q1 FY27 Revenue Growth, Margin Trends, And Outlook
- Infosys Share Price And Market Pulse: What Drives The Early Gains In Indian Equities
- Ustr Tariff Impact On Indian Exports And Stocks: A Retail Investor's Guide
Frequently Asked Questions
What were Hindustan Unilever's Q1 revenue and net profit?
Revenue rose 10% year-on-year to Rs 17,341 crore, while net profit declined 3% to Rs 2,673 crore.
What was Hindustan Unilever's underlying volume growth in Q1?
Underlying volume growth was 5% in Q1, below the Street's 6-8% expected range.
How did the Home Care and Personal Care segments perform in Q1?
Home Care delivered double-digit growth, Personal Care grew 4% on an underlying basis, and segment revenue rose 3% YoY to Rs 2,624 crore.
What is the EBITDA and margin for Hindustan Unilever in Q1?
EBITDA was Rs 3,947 crore with a margin of 22.8%.
What is the FY27 outlook for Hindustan Unilever?
Management expects FY27 to be stronger than FY26, driven by portfolio transformation, stable demand and continued investments in market development.
What price actions were observed or implied in the Q1 results?
Prices were increased in categories affected by higher input costs; notable examples include nearly 10% hikes for Dove Shampoo and up to 8% for Rin since March 4.
Conclusion
In the near term, Hindustan Unilever's Q1 results show resilience in revenue growth but continued pressure on profitability from input costs and a softer volume backdrop. For the retail investor, the take-away is to watch whether volume momentum improves and whether pricing can sustain margins as we move through FY27. A disciplined approach–tracking Hindustan Unilever share price against the company's growth trajectory and margins–offers the best way to navigate the stock into the next earnings cycle.
Open your trading and demat account here
Reference :
1 : Ndtvprofit

Share Price IOCL And City Fuel Data: Petrol, Diesel, And CNG Trends For Retail Investors
Key Takeaways
- Petrol Prices Show City-To-City Variation: Hyderabad At The Top, Chandigarh At The Bottom In This Snapshot.
- CNG Prices Stayed Largely Stable Across Major Cities On July 28, With City-Specific Variations.
- Diesel Prices Follow A Regional Pattern With Thiruvananthapuram Highest In The Listed Cities And Chandigarh The Lowest.
- Export Duties And The Daily Revision Mechanism Drive Short-Term Movements, While IOCL Stock Price And Peers Reflect The Broader Margin Environment.
City-by-city fuel data reveals the pulse of India's retail investors. Share Price IOCL has become a shorthand for how crude moves, VAT, and logistics ripple through earnings. On July 28, petrol prices across major Indian cities show Hyderabad at ₹115.69 per litre, Thiruvananthapuram at ₹115.49, Chandigarh at ₹98.10–the lowest petrol price in the sample–while New Delhi at ₹102.12 and Lucknow at ₹102.05 per litre reflect mid-range markets. This micro view helps investors gauge the energy sector's current mood and potential stock trajectories.
Diesel prices show a similar regional pattern: Thiruvananthapuram ₹104.40 per litre, Hyderabad ₹103.82, and Chandigarh ₹86.09. In New Delhi, Gurgaon, and Noida, diesel prices remain below ₹96 per litre. CNG prices remained largely stable across major cities, with New Delhi ₹83.09 per kg, Mumbai ₹86, Ahmedabad ₹82.25, and Gurgaon/Noida ₹91.70. Bengaluru ₹90, Jaipur ₹90.91, Chennai ₹91.50, Pune ₹92.50, Kolkata ₹93.50, Lucknow ₹95.75, and Hyderabad ₹97 per kg complete the city-wide picture.
The price changes come after oil marketing companies recently increased petrol and diesel prices by around ₹7.5 per litre in response to higher crude values amid tensions in West Asia. The government, in its latest fortnightly review, raised the export duty on diesel and aviation turbine fuel while leaving the export levy on petrol unchanged. The daily revision mechanism remains in place, with any future change in petrol price, diesel, or CNG rates depending on broader market conditions and official pricing decisions.
| City | Petrol Price (₹/L) |
|---|---|
| Hyderabad | ₹115.69 |
| Thiruvananthapuram | ₹115.49 |
| Chandigarh | ₹98.10 |
| New Delhi | ₹102.12 |
| Lucknow | ₹102.05 |
| City | Price (₹/Kg) |
|---|---|
| New Delhi | ₹83.09 |
| Mumbai | ₹86 |
| Ahmedabad | ₹82.25 |
| Gurgaon & Noida | ₹91.70 |
| Bengaluru | ₹90 |
| Jaipur | ₹90.91 |
| Chennai | ₹91.50 |
| Pune | ₹92.50 |
| Kolkata | ₹93.50 |
| Lucknow | ₹95.75 |
| Hyderabad | ₹97 |
From the diesel side, Thiruvananthapuram remains the highest among the listed cities at ₹104.40 per litre, followed by Hyderabad at ₹103.82. Chandigarh sits at ₹86.09, the lowest in this subset, while New Delhi, Gurgaon and Noida stay below ₹96 per litre. The mix of VAT, freight, and dealer margins explains the regional dispersion in both petrol and diesel prices, underscoring why sector earnings can diverge city by city even when the base price is similar.
For retail investors, the city-level price mosaic has practical implications beyond consumer costs. When petrol and diesel prices rise in a given month, refiners can see improved margins, but demand can soften in higher-price markets; the net effect on IOCL stock price or BPCL and HPCL stock price depends on the balance of margins, refinery utilization, and export policy risk. The market’s focus tends to shift toward the sector’s overall margin trajectory, crude price direction, and regulatory decisions, rather than a single city’s price move.
IOCL stock price and peers are not a one-to-one function of pump prices, but the trend signals matter. The ongoing price revision mechanism means that a one-day spike or drop can be followed by another adjustment as crude moves or as VAT and freight charges shift. For investors who want to quantify the impact, consider combining city-price signals with refinery margins, export duty changes, and crude price scenarios. This multi-factor approach is more robust than reacting to a single data point.
Economic signals from the energy complex are not isolated. The sanctions and guidelines around exports, the evolving freight dynamics, and the fiscal regime all feed into downstream earnings and, by extension, stock valuations. The data from July 28 illustrate how a broad set of factors converges: domestic demand signals, regulatory risk, and global crude flows. Keeping these in view helps frame the IOCL stock price and related energy equities as part of a larger, dynamic investment thesis rather than as isolated price spikes. As you build your view, you can also leverage Swastika's Sarthi AI stock assistant to model how different macro scenarios could influence IOCL stock price and other oil majors. Swastika's Sarthi AI stock assistant can help you test your hypotheses with institutional-grade research across stocks and indices.
Share Price IOCL: How The City Fuel Data Echoes In IOCL Stock Price And Sector Trends
The city-level fuel data is a practical proxy for understanding IOCL's earnings resilience and how the market prices sector risk. IOCL stock price tends to reflect broader energy margins, crack spreads, and policy signals rather than any single city's price point. When petrol and diesel prices are pushed higher due to crude costs and export duties, refiners may see a boost in margins, particularly in days when pump prices are rising across multiple urban centers. Conversely, if demand damages margins due to persistently high prices, IOCL stock price can retreat even if overall crude remains strong. The July 28 snapshot, which shows Hyderabad leading petrol costs and Thiruvananthapuram leading diesel costs in the listed cities, is a reminder that the domestic price environment is not uniform, and regional factors can influence how earnings translate into stock performance.
In practice, investors should watch how IOCL responds to shifts in the price mix–petrol versus diesel–and how export policy updates alter downstream profitability. The ongoing daily revision mechanism means that the stock may react to the latest price data in near real time, especially when combined with a shifting macro environment, such as crude price spikes or policy changes that affect export duties. This is why a holistic view–city price data, crude movements, and policy signals–helps frame IOCL stock price versus its peers. IOC stock price behavior often tracks a similar logic, as these companies share exposure to crude and refined product margins, regulatory risk, and foreign exchange dynamics that influence input costs and downstream profitability.
IOC Stock Price Dynamics: How Petrol, Diesel, And CNG Movements Influence Oil Stocks
For investors who track IOC stock price as a proxy for the oil marketing sector, the narrative around price dispersion across cities adds context. When one city experiences a sharp price move, it may reflect localized demand shocks, VAT adjustments, or dealer margins; when many cities move in the same direction, the market tends to price in broader macro factors like crude price trends and export policy. The July 28 data set–showing significant petrol variance and notable diesel regional differences–serves as a reminder that stock prices often encode multiple streams of information: demand, margins, and policy risk. In this environment, the distinction between IOCL stock price and IOC stock price can blur as markets price the sector on a combined view of fundamentals and policy risk rather than isolated pump prices alone.
In addition to city-level signals, investors should monitor the export duty framework. The government’s decision to raise the export duty on diesel and aviation turbine fuel while keeping petrol duties unchanged is a structural factor that can influence downstream margins. IOCL, BPCL, and HPCL stocks will react not just to crude movements but also to how these duties alter the potential profitability of diesel-heavy products versus petrol, a nuance that traders should incorporate into their models. The price data from July 28 helps frame this dynamic by illustrating where regional price pressure sits and how it might translate into earnings surprises or revisions for Indian oil stocks.
BPCL Stock Price And HPCL Stock Price: How Export Duties And Crude Trends Influence Valuations
BPCL stock price and HPCL stock price remain sensitive to the same macro and policy cues that affect IOCL. When diesel margins improve due to higher pump prices, diesel-heavy players can see a meaningful bump in earnings potential, provided export duties and domestic demand environments allow them to capture incremental value. Conversely, petrol-stress scenarios may tilt sentiment toward refining margins in petrol-heavy configurations. The city-level price data–such as Thiruvananthapuram’s ₹104.40/diesel price and Hyderabad’s ₹115.69 petrol price–helps explain why some regions may contribute more to a company’s margin mix in a given period, while others reflect more cautious outlooks due to demand or tax dynamics. In a diversified portfolio, BPCL and HPCL stock price sensitivity to these regional and regulatory signals complements IOCL’s stock price dynamics and helps investors build cross-stock hedges against policy risk and margin volatility.
What This Means For Retail Investors: Reading The Data For Stock Selection
The city-price mosaic is not a trading signal in isolation, but it is a valuable context for stock-selection decisions in the energy space. For a retail investor, the key takeaway is to fuse the city-level price data with macro drivers such as crude direction, export duties, and domestic demand dynamics. IOCL, BPCL, and HPCL investors should look for sustained margin expansion cues, consistent refinery utilization, and policy clarity that reduces near-term uncertainty. The price data–Hyderabad’s ₹115.69 petrol, Thiruvananthapuram’s ₹104.40 diesel premium in that subset, and the stable CNG trajectory–signal a nuanced environment where some regions show stronger demand resilience than others. This nuance can influence entry and exit points for downstream oil stocks and the risk profile of your energy exposure.
Related Reads
- IOCL Share Price And LPG Market Update August 2026
- Ioc Share Price And The Oil Stocks Pulse: Petrol Price Stability And Global Crude Signals For Indian Retail Investors
- IOC Share Price Insights: Petrol And Diesel Prices Hold Steady As Crude Tops $100
Conclusion
The city-level fuel data on July 28 offers a practical lens into how macro forces–crude prices, VAT, freight, and export duties–filter into regional price signals and, by extension, the earnings landscape for IOCL, BPCL, and HPCL. For the retail investor, the takeaway is not to chase a single city’s price move but to recognize how regional price dispersion reflects demand signals, tax captures, and margin dynamics across downstream oil stocks. The daily revision mechanism means volatility can arise from policy shifts or crude shocks, but consistent margin trends and clear regulatory direction tend to drive steadier stock performance over time.

Hindustan Unilever Share Price: Q1 FY27 Revenue Growth, Margin Trends, And Outlook
Key Takeaways
- Hindustan Unilever's Q1 FY27 revenue rose 10.2% YoY to Rs 17,149 crore.
- Underlying growth (USG) stood at 10%, driven equally by volume and price.
- EBITDA rose 8% YoY to Rs 3,947 crore with a 23% margin.
- Hindustan Unilever shares tumbled 5% to Rs 2,064 per share after the results.
Investors tracking Hindustan Unilever Share Price were given a fresh data point from Hindustan Unilever's Q1 FY27 results. Revenue from operations rose 10.2% YoY to Rs 17,149 crore in the quarter, driven by a balanced mix of volume and price. The underlying sales growth (USG) stood at 10%, marking the strongest growth in 13 quarters. EBITDA for the quarter rose 8% YoY to Rs 3,947 crore, while the EBITDA margin contracted by 40 basis points to 23% from 23.4%.
The quarterly performance reflects a broad-based growth story across Hindustan Unilever's diversified portfolio. In Home Care, the segment delivered 14% USG–its strongest performance in three years–supported by high-single-digit underlying volume growth and disciplined market development. This combination reinforces Hindustan Unilever's leadership position as it leverages consumer-focused innovations to sustain growth even in challenging macro conditions.
Beauty & Wellbeing posted 12% USG, with Hair Care delivering double-digit growth and benefiting from premium products and future formats. The category also saw continued leadership in premium segments, aided by a strategic emphasis on Skin Care improvements and Colour Cosmetics expansion, which reported high-single-digit growth aided by premium SKUs.
In Personal Care, Hindustan Unilever recorded 4% USG, primarily driven by pricing amid sustained palm oil inflation. Skin Cleansing posted mid-single-digit growth, while Premium Bars showed competitive double-digit, volume-led growth. The company further strengthened its leadership in the Bodywash category, underscoring the resilience of its personal care portfolio in price-sensitive inflationary environments.
Foods delivered 7% USG, supported by mid-single-digit UVG and continued momentum in Lifestyle Nutrition and Coffee. Premium Tea posted low-single-digit USG, while Coffee achieved double-digit volume-led growth, aided by the ongoing scale-up of ready-to-drink (RTD) beverages and Bru Gold. Lifestyle Nutrition maintained double-digit growth, with Boost crossing the Rs 1,000 crore annual turnover milestone. Horlicks Superfoods and RTD products also continued to gain traction, contributing to the overall growth mix.
HUL's outlook for FY27 remains constructive: the company expects FY27 to be better than FY26, driven by portfolio and channel transformation. Commodity volatility persists, and inflationary pressures are expected to stay in the short term. The management reiterates that consolidated EBITDA margin should stay around the current guided range while maintaining a focus on driving competitive, volume-led revenue growth anchored to its key priorities.
For deeper stock-level insights, you can explore Swastika's Sarthi AI stock assistant: Swastika's Sarthi AI stock assistant.
Hindustan Unilever Share Price And Q1 FY27 Revenue Growth
The Hindustan Unilever Share Price narrative starts with a robust revenue and margin story. Revenue from operations rose 10.2% YoY to Rs 17,149 crore in Q1 FY27, accompanied by an underlying growth (USG) of 10%, which was driven equally by volume and price. This is a signal that the company is managing both pricing power and volume resilience in a balanced way, despite macro headwinds. EBITDA rose 8% YoY to Rs 3,947 crore, while the EBITDA margin contracted by 40 basis points to 23% from 23.4% in the prior year.
In a portfolio that spans Home Care, Beauty & Wellbeing, Personal Care, and Foods, the name of the game is currency of growth: market share gains through innovations, disciplined marketing, and a disciplined cost structure that keeps profitability under pressure from commodity volatility but supports volume-led expansion over time.
Hindustan Unilever EBITDA Margin Trends In Q1 FY27
The quarter shows a nuanced margin story. EBITDA rose 8% YoY to Rs 3,947 crore, but the EBITDA margin declined by 40 bps to 23% from 23.4% prior. This contraction hints at ongoing cost pressures–likely from palm oil and other input costs–that the company is offsetting with a balanced mix of higher pricing and efficiency measures. Management indicates the margin is expected to hover around the currently guided range, even as revenue growth remains volume-led and broad-based across segments.
While the headline margin compression may disappoint some traders, the stronger top line and USG trajectory underwrite a constructive stance for Hindustan Unilever Share Price, particularly if pricing power and cost controls stay in sync through the rest of FY27.
Hindustan Unilever Segment Performance: Home Care, Beauty &Amp Wellbeing, Personal Care, And Foods
Home Care delivered 14% USG, the strongest performance among the segments in the quarter, aided by high-single-digit UVG. The disciplined market development and consumer-centric innovations helped consolidate market leadership while maintaining volume resilience. Beauty & Wellbeing registered 12% USG, supported by high-single-digit UVG. Hair Care delivered double-digit growth, backed by premium products and new formats, reinforcing the segment's leadership position. Skin Care and Colour Cosmetics also contributed with high-single-digit growth, aided by double-digit expansion in Premium Skin Care.
Personal Care posted 4% USG, driven primarily by higher prices in response to palm oil inflation. Skin Cleansing grew in mid-single digits, with Premium Bars delivering double-digit, volume-led growth. Hindustan Unilever continued to strengthen its leadership in the Bodywash category, reflecting both brand strength and ongoing innovation.
Foods grew 7% USG, buoyed by mid-single-digit UVG and continued momentum in Lifestyle Nutrition and Coffee. Premium Tea generated low-single-digit USG, while Coffee posted double-digit growth in volume, aided by the ongoing scale-up of RTD and Bru Gold. Lifestyle Nutrition sustained double-digit growth, with Boost crossing the Rs 1,000 crore annual turnover milestone. Horlicks Superfoods and RTD innovations also gained traction, contributing to the overall momentum across the Foods portfolio.
HUL's outlook remains positive for FY27: the company expects FY27 to be better than FY26, driven by portfolio and channel transformation. Commodity volatility and inflationary pressures are expected to persist in the near term, but the management asserts that consolidated EBITDA margin should remain around the current guided range as it focuses on driving competitive, volume-led revenue growth aligned to its priorities.
Investors should monitor how this growth profile translates into Hindustan Unilever Share Price in the near term, with particular attention to input costs, pricing actions, and the pace of market development investments.
Hindustan Unilever Market Cap And Dividend Considerations
While the quarterly results highlight strong top-line momentum and segmental strength, the material detail on Hindustan Unilever Market Cap is not provided in the release. Valuation for the stock typically reflects a mix of earnings visibility, cash flows, and growth potential across its diversified portfolio. The data here focuses on operational performance and outlook rather than explicit market capitalization figures. Investors often weigh dividends as part of total returns; Hindustan Unilever Dividend considerations depend on policy, cash flow stability, and board decisions, which are not detailed in the quarter's data.
Looking ahead, the dividend angle remains a relevant factor for long-term holders, as Hindustan Unilever has historically prioritized steady cash returns alongside growth investments. For traders and long-only investors, the balance between margin resilience, USG-driven growth, and input-cost management will likely influence Hindustan Unilever Share Price trajectories in FY27.
Related Reads
- Infosys Share Price And Market Pulse: What Drives The Early Gains In Indian Equities
- Ustr Tariff Impact On Indian Exports And Stocks: A Retail Investor's Guide
- Tamil Nadu Reforms And The MSME Charter: A Roadmap To An Industrial Turnaround
Frequently Asked Questions
What was Hindustan Unilever's revenue in Q1 FY27 and how did it change year-on-year?
Revenue from operations rose 10.2% YoY to Rs 17,149 crore.
What was the underlying sales growth (USG) in Q1 FY27 and which factors drove it?
USG was 10%, driven equally by volume and price.
What was Hindustan Unilever's EBITDA and EBITDA margin in Q1 FY27?
EBITDA rose 8% YoY to Rs 3,947 crore, with the EBITDA margin at 23% after contracting 40 basis points from 23.4%.
How did Hindustan Unilever's stock react after the results?
Hindustan Unilever shares tumbled 5% to Rs 2,064 per share on the BSE.
What is Hindustan Unilever's FY27 outlook?
FY27 is expected to be better than FY26, with inflationary pressures in the short term. The company aims to keep consolidated EBITDA margin around the current guided range and pursue volume-led revenue growth anchored to its priorities.
Conclusion
The Q1 FY27 results depict a company navigating a favorable top-line trajectory across its portfolio while facing margin pressures from inputs. Revenue from operations rose 10.2% YoY to Rs 17,149 crore, with USG at 10% and EBITDA at Rs 3,947 crore, delivering a margin of 23% after a 40-basis-point compression. The stock reaction – a roughly 5% move lower to Rs 2,064 per share – reflects the tug-of-war between growth momentum and margin headwinds in a volatile commodity backdrop.
Open your trading and demat account here
Reference :
1 : Economictimes
.jpg)
Manipal Health IPO Review: Should You Subscribe or Avoid?
The Manipal Health IPO is one of the largest healthcare IPOs in India, offering investors an opportunity to participate in the country's leading multi-speciality hospital network. While the company has an unmatched hospital footprint, strong operating efficiency, and long-term growth potential, the premium valuation, high leverage, and regional concentration warrant careful evaluation before investing.
India's healthcare sector is entering a new growth phase, supported by rising health awareness, increasing insurance penetration, an ageing population, and growing demand for specialised medical care. Against this backdrop, the Manipal Health IPO has emerged as one of the most anticipated public offerings of 2026.
Manipal Health Enterprises Limited (MHEL) is not just another hospital operator. It is India's largest multi-speciality hospital chain by licensed bed capacity, with a diversified presence across major metropolitan cities and rapidly expanding regional markets. Over the past few years, the company has strengthened its position through strategic acquisitions while continuing to improve operational efficiency.
This detailed Manipal Health IPO review covers everything investors need to know, from IPO details and business fundamentals to financial performance, valuation, opportunities, risks, and whether the issue deserves a place in your portfolio.
Key Takeaways
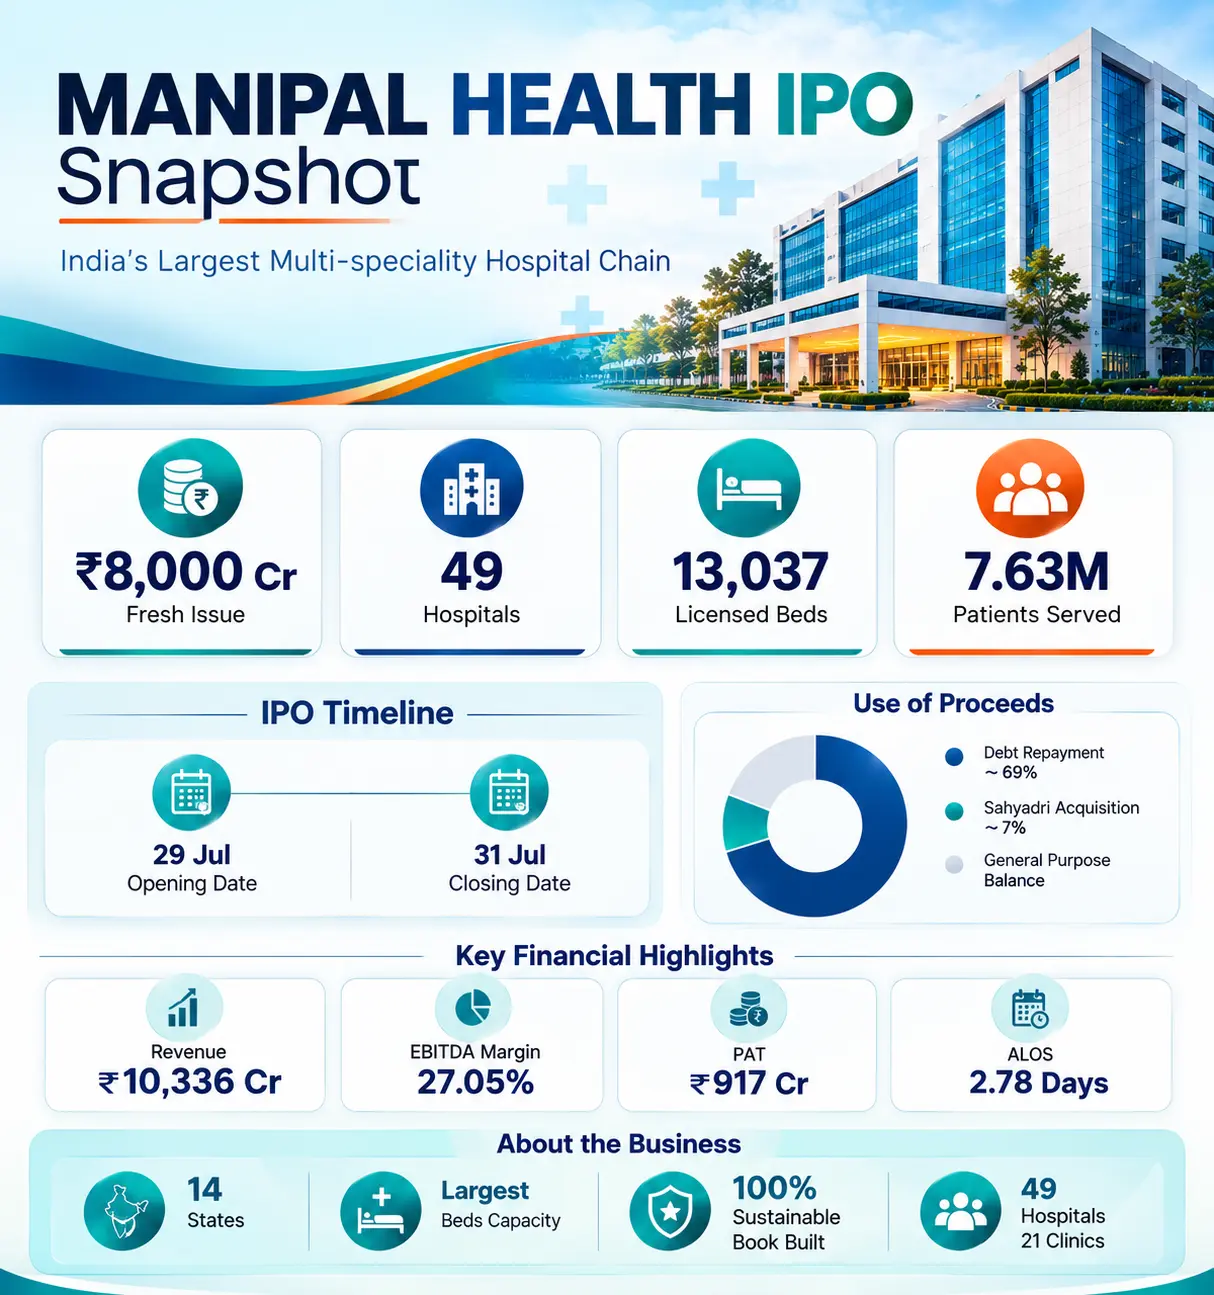
- Manipal Health is India's largest multispecialty hospital chain by licensed bed capacity.
- The company operates 49 hospitals with more than 13,000 licensed beds across 14 states and union territories.
- Most IPO proceeds will be utilised for debt repayment and increasing ownership in Sahyadri Hospitals.
- Strong operational metrics such as industry-leading ALOS and a negative working capital cycle support long-term growth.
- Premium valuation, high leverage, and geographic concentration remain the primary investment concerns.
- Swastika Investmart has assigned the IPO an "Avoid" rating from a valuation perspective.
Manipal Health IPO Snapshot
Note: The final price band and bid lot will be announced by the company before the issue opens.
Why is the Manipal Health IPO Drawing Investor Attention?
Unlike many healthcare IPOs that primarily fund expansion projects, the Manipal Health Enterprises IPO is designed to strengthen the company's balance sheet while supporting future growth.
A significant portion of the fresh issue proceeds will be used to reduce debt by repaying borrowings of its subsidiary, Manipal Hospitals Private Limited. Lower debt can improve profitability through reduced interest costs while creating financial flexibility for future acquisitions and hospital expansion. At the same time, the company plans to increase its ownership in Sahyadri Hospitals, further consolidating one of India's fastest-growing hospital networks.
The IPO also provides investors exposure to India's rapidly expanding private healthcare industry, where demand continues to outpace hospital infrastructure across several regions.


Inside Manipal Health Enterprises: India's Largest Hospital Network
Manipal Health Enterprises Limited is the largest pan-India multi-speciality hospital chain by licensed bed capacity, operating an integrated healthcare ecosystem that spans hospitals, outpatient clinics, diagnostics, pharmacies, and advanced tertiary care services. As of March 31, 2026, the company operates:
- 49 multi-speciality hospitals
- 21 outpatient clinics
- Presence across 14 states and union territories
- 13,037 licensed beds
- More than 7.63 million patients served during FY26
Manipal Health has built leadership positions across several major healthcare markets, including Bengaluru, Kolkata, and Pune, making it the only private hospital chain to lead by bed capacity in all three metro regions. Rather than competing solely on hospital count, the company focuses on complex, high-value medical treatments through specialised clinical excellence.
Its major treatment areas include:
- Cardiac Sciences
- Oncology
- Neurosciences
- Gastro Sciences
- Orthopaedics
- Renal Sciences
Collectively known as CONGO-R specialities, these accounted for approximately 64.3% of gross inpatient revenue in FY26, reflecting the company's emphasis on tertiary and quaternary healthcare.
How Does Manipal Health Generate Revenue?
Manipal follows a diversified healthcare delivery model, reducing dependence on any single medical speciality, geography, or patient category.
Its primary revenue streams include:
- Inpatient treatments
- Outpatient consultations
- Advanced surgeries
- Diagnostic services
- Pharmacy sales
- Day-care procedures
- Corporate healthcare partnerships
- Insurance and TPA-based patients
One notable aspect of its business model is its strong relationship with insurers and Third-Party Administrators (TPAs). Nearly half of its patient revenue comes through insurance-backed treatments. Although insurance patients generally yield lower margins than self-paying patients, the company has built efficient billing and collection processes that enable it to maintain a negative working capital cycle of just 13 days, supporting healthy cash flow despite the scale of operations.
India's Healthcare Opportunity Remains Massive
The long-term investment case for the Manipal Health IPO extends beyond the company itself. India continues to face a significant healthcare infrastructure gap.
According to industry data referenced in the company's prospectus, India has approximately 16 hospital beds per 10,000 people, compared with a global average of around 33 beds per 10,000 people. In many non-metro regions, the availability is even lower.
This structural shortage creates a long runway for private hospital operators with strong brands, clinical expertise, and the financial capacity to expand. Manipal Health has already established a nationwide platform and is well-positioned to benefit from increasing healthcare spending, higher insurance penetration, and growing demand for specialised medical care.
Growth Has Been Driven by Both Expansion and Acquisitions
Instead of relying solely on organic expansion, Manipal Health has pursued a disciplined "buy and build" strategy to strengthen its market position. Some of its major acquisitions include:
These acquisitions have significantly expanded the company's geographical footprint while increasing its licensed bed capacity from 9,520 beds in FY24 to 13,037 beds in FY26. The strategy has also helped Manipal establish stronger positions in Eastern and Western India, reducing its dependence on organic expansion alone.
A Closer Look at Manipal Health's Financial Performance
The financial performance of Manipal Health Enterprises Limited reflects the benefits of its aggressive expansion strategy over the past few years. While acquisitions have accelerated revenue growth, they have also increased debt and integration costs, which investors should consider while evaluating the IPO. Here's a snapshot of the company's recent financial performance.
Between FY24 and FY26:
- Revenue from operations grew at a CAGR of 29.41%.
- Profit after tax increased at a CAGR of 31.11%.
- EBITDA margins remained healthy despite the integration of multiple acquisitions.
- The company continued to generate strong operating cash flows through disciplined hospital operations.
Although profitability improved during the period, investors should note that recent acquisitions have temporarily increased leverage and finance costs, making debt reduction one of the key objectives of the IPO.
You can also read: Manipal Hospitals IPO Valuation And Investor Take
Beyond Revenue: The Operating Metrics That Differentiate Manipal Health
For hospital businesses, revenue alone doesn't provide the complete picture. Operational efficiency often determines long-term profitability, capital productivity, and return on investment. Manipal Health has consistently performed well across several industry-specific metrics that investors should monitor.
Industry-Leading Average Length of Stay (ALOS)
One of the company's strongest operating indicators is its Average Length of Stay (ALOS), which improved from 2.93 days in FY24 to 2.78 days in FY26. A shorter hospital stay allows beds to become available more quickly, enabling hospitals to treat a higher number of patients without adding new infrastructure.
What's particularly impressive is that this improvement has been achieved even as the company has increased its focus on complex tertiary and quaternary treatments, which typically require longer recovery periods.
Healthy Occupancy Leaves Room for Growth
The company's network reported an occupancy rate of 64.47% during FY26. While this is slightly below some listed peers, management considers it a strategic advantage rather than a weakness.
Hospitals generally begin major capacity expansion when occupancy approaches 70%. Since Manipal still has available capacity across several facilities, it can increase patient volumes and revenue without making significant additional capital investments. This provides an opportunity to improve operating leverage over the coming years.
Strong Revenue Per Occupied Bed
Manipal Health reported an Average Revenue Per Occupied Bed (ARPOB) of approximately ₹68,938 per day in FY26.
A healthy ARPOB indicates the company's ability to generate higher revenue from specialised procedures and premium healthcare services rather than relying solely on patient volume. Combined with its improving ALOS and stable occupancy, this reflects efficient utilisation of hospital assets.
You can also read: Manipal Health Enterprises IPO: Week's Largest Mainboard
Negative Working Capital Strengthens Cash Flow
Another noteworthy aspect of Manipal's business model is its negative working capital cycle of 13 days. Despite deriving a significant share of revenue through insurance companies and third-party administrators (TPAs), the company has developed efficient billing and collection systems that support healthy cash generation. This improves liquidity while reducing dependence on short-term funding for daily operations.
Where Will the IPO Proceeds Be Used?
Unlike IPOs that primarily fund new expansion projects, the Manipal Health Enterprises IPO focuses on strengthening the company's financial position. The proceeds from the fresh issue will be deployed across three major areas:
The largest allocation is earmarked for reducing outstanding borrowings, including listed non-convertible debentures (NCDs) carrying interest costs. Lower debt could improve earnings by reducing finance expenses while strengthening the balance sheet for future expansion.
The acquisition of the remaining stake in Sahyadri Hospitals will also increase the company's ownership in one of its key hospital platforms, allowing greater operational integration and long-term value creation.
Why Debt Reduction Could Be a Turning Point for Manipal Healthcare?
The company's rapid expansion through acquisitions has significantly increased its borrowings over the past few years. Rather than raising fresh capital solely for capacity expansion, management has prioritised deleveraging. This approach offers several potential benefits:
- Lower annual interest expenses.
- Improved profitability and earnings quality.
- Stronger balance sheet.
- Greater flexibility for future acquisitions.
- Enhanced financial resilience during economic slowdowns.
If executed successfully, the IPO could mark a transition from acquisition-led expansion to improved profitability and operational consolidation.
What Makes Manipal Health a Strong Long-Term Business?
Several structural strengths support the company's long-term growth outlook beyond the IPO.
Market Leadership
Manipal Health is India's largest multi-speciality hospital chain by licensed bed capacity, giving it significant scale advantages across procurement, clinical expertise, technology adoption, and patient acquisition.
Diversified Geographic Presence
The company operates hospitals across 14 states and union territories while maintaining leadership positions in Bengaluru, Kolkata, and Pune. This broad footprint reduces dependence on a single city compared to many regional hospital operators.
High-Value Clinical Specialities
More than 64% of inpatient revenue comes from high-acuity specialities such as cardiac sciences, oncology, neurosciences, gastro sciences, orthopaedics, and renal sciences. These treatments generally command better pricing and create stronger patient trust.
Proven Acquisition Strategy
Instead of pursuing rapid greenfield expansion alone, the company has successfully integrated several leading hospital chains, including Columbia Asia, AMRI, Medica, and Sahyadri. This strategy has accelerated both capacity expansion and market penetration.
Strong Industry Tailwinds
India's healthcare infrastructure remains significantly underpenetrated relative to global standards. Rising healthcare awareness, higher insurance coverage, increasing disposable income, and an ageing population are expected to support long-term demand for organised private healthcare providers.
Risks to Consider Before Applying for the Manipal Health IPO
No IPO is free from risks, and Manipal Health Enterprises is no exception. While the company has built a strong healthcare franchise, investors should evaluate the following factors before making an investment decision.
Premium Valuation Leaves Limited Margin of Safety
One of the biggest concerns is valuation. Based on FY26 earnings, the company is expected to command a premium valuation compared with most listed hospital peers. Such pricing assumes continued growth, successful integration of acquisitions, and sustained profitability. A premium valuation can reduce listing upside if market sentiment weakens or quarterly performance falls short of expectations.
High Debt Despite Planned Repayment
Although a large portion of the fresh issue proceeds will be used to repay debt, the company currently carries significant borrowings due to multiple acquisitions completed over the last few years. While debt reduction should strengthen the balance sheet over time, investors should monitor:
- Interest cost reduction after the IPO
- Improvement in leverage ratios
- Cash flow generation post listing
Heavy Dependence on Karnataka
Nearly 46.4% of FY26 revenue comes from Karnataka, making the business geographically concentrated despite its nationwide presence. Any regulatory changes, pricing restrictions, competitive pressure, or healthcare policy changes in the state could impact financial performance.
Acquisition Integration Risk
Manipal Health has rapidly expanded through acquisitions including:
- Columbia Asia
- AMRI Hospitals
- Medica Synergie
- Sahyadri Hospitals
Although these acquisitions strengthen the network, integrating hospital systems, doctors, technology platforms, and operating processes is a complex exercise that may take several years before delivering full synergies.
Regulatory and Legal Matters
The company has disclosed certain ongoing legal and regulatory matters, including:
- Investigations relating to kidney transplant cases at Manipal Hospital Jaipur.
- Litigation concerning HCMCT Manipal Hospital, Dwarka.
- Disputes involving minority shareholders of acquired subsidiaries.
While management believes these issues are manageable and has disclosed them in the RHP, investors should monitor future developments.
Dependence on High-End Specialities
Around 64.3% of inpatient revenue comes from high-value specialities such as:
- Cardiac Sciences
- Oncology
- Neurosciences
- Gastro Sciences
- Orthopaedics
- Renal Sciences
Although these segments generate better profitability, they also require continuous investment in specialist doctors, medical equipment, and advanced technology.
Should You Apply for the Manipal Health IPO?
The Manipal Health IPO represents an opportunity to invest in one of India's largest and fastest-growing private hospital chains. The company has established a strong presence across major cities, demonstrated healthy revenue growth, maintained industry-leading operational efficiency, and continues expanding through acquisitions and capacity additions.

However, investors should balance these positives against the premium valuation, recent debt-led expansion, and integration risks associated with multiple acquisitions.
According to Swastika Investmart, while Manipal Health is undoubtedly a quality healthcare business with strong long-term prospects, the IPO pricing appears aggressive relative to the current risk-reward equation. Therefore, the issue has been assigned an "Avoid" rating from a valuation perspective. Long-term investors may prefer to monitor the company's post-listing performance, debt reduction, and earnings trajectory before considering an investment.
Frequently Asked Questions (FAQs)
What is the Manipal Health IPO date?
The Manipal Health IPO will open on July 29, 2026, and close on July 31, 2026.
What is the issue size of the Manipal Health IPO?
The IPO includes a Fresh Issue of up to ₹8,000 crore along with an Offer for Sale of up to 21.61 million equity shares.
How will the IPO proceeds be used?
The company plans to utilise the fresh issue proceeds for:
- Repayment of borrowings of Manipal Hospitals Private Limited
- Acquisition of an additional stake in Sahyadri Hospitals
- General corporate purposes
What does Manipal Health Enterprises do?
Manipal Health Enterprises is India's largest multi-speciality hospital network by licensed bed capacity. It operates 49 hospitals, 21 clinics, and serves millions of patients across 14 states and union territories.
Is the Manipal Health IPO good for long-term investment?
The company has a strong business model, leading market position, and long-term growth opportunities. However, investors should carefully evaluate its premium valuation, debt profile, and acquisition-related risks before making an investment decision.
Where can I get the latest Manipal Health IPO updates?
For the latest Manipal Health IPO GMP, subscription status, allotment updates, listing details, and expert IPO analysis, visit Swastika Investmart, where you can access timely market insights and detailed IPO coverage.
Final Thoughts
The Manipal Health IPO offers investors exposure to one of India's leading healthcare providers operating in a sector with significant long-term growth potential. Its strong brand, expanding hospital network, improving operational efficiency, and focus on tertiary and quaternary care make it a quality healthcare business.
That said, IPO investing is not just about the quality of the company but also the price at which it is offered. Given the premium valuation and existing leverage, investors should carefully assess the risk-reward before applying. For the latest Manipal Health IPO GMP, subscription status, allotment updates, listing analysis, and expert IPO reviews, stay connected with Swastika Investmart for timely market insights and comprehensive IPO coverage.
Godfrey Phillips Share Price: Q1 FY27 Revenue, Margin Trends, And Outlook
Key Takeaways
- Q1 FY27 revenue reached Rs 3,820 crore, while gross margins fell to 7.8% from 15.3%.
- Domestic cigarette sales volume slipped 2% YoY, and unmanufactured tobacco exports stood at Rs 248 crore–7% of net sales.
- Total income, including other income, rose to Rs 3,897.83 crore in Q1 FY27.
- Tax burden and illicit trade remain headwinds; investors should watch the Godfrey Phillips Share Price and consider Swastika's Sarthi AI stock assistant for deeper insights.
Investors tracking the Godfrey Phillips Share Price are watching a nuanced picture emerge from the June quarter. Gross revenue rose to Rs 3,820 crore, but gross profit margin contracted to 7.8% from 15.3% a year ago, underscoring profitability pressure even as topline growth persists. Total expenses more than doubled to Rs 3,675 crore, widening the gap between revenue and earnings and signaling rising cost pressures amid a tougher regulatory backdrop. In this context, the stock narrative hinges on both the resilience of brands and the ability to manage costs and export exposures.
Godfrey Phillips Share Price: Q1 FY27 Revenue Snapshot
In the June quarter, including other income, Godfrey Phillips' total income rose to Rs 3,897.83 crore in Q1 FY27, indicating a robust top-line base even as margins compress. Gross revenue stood at Rs 3,820 crore, with a gross profit margin of 7.8% versus 15.3% a year earlier. The export contribution came from unmanufactured tobacco sales of Rs 248 crore, accounting for 7% of net sales. Domestic cigarette sales volume slipped by 2% year on year, reflecting ongoing regulatory pressure and shifts in consumer demand. The earnings release arrived after market hours on Monday, which may influence near-term trading dynamics.
According to Sharad Aggarwal of Godfrey Phillips, The higher tax burden has not only impacted industry profitability but also contributed to the growth of illicit trade, which remains a significant concern for the legal cigarette industry.
Reference :
1 : Economictimes
Beyond the headline revenue, the quarter highlights a strategic mix between domestic volumes and export activity. The company’s leadership ties these dynamics to the evolving tax regime and enforcement environment, which shapes both profitability and the competitive landscape for legally manufactured cigarettes. The balance between brand strength, distribution reach, and regulatory compliance will play a central role in how the Godfrey Phillips Share Price responds to ongoing policy developments.
Godfrey Phillips Quarterly Results: Margin Contraction And Volume Trends
Analyzing the quarterly results reveals the core margin story. The gross profit margin compressed to 7.8% from 15.3% a year earlier, signaling tighter margins even as revenue expanded. Total expenses surged to Rs 3,675 crore during the June quarter, underscoring the cost headwinds facing the business. Despite this, the company reported total income of Rs 3,897.83 crore in Q1 FY27 when including other income, illustrating that non-operating items or one-off factors provided some offset to the operating profitability squeeze. The post-market release timing of the earnings adds a layer of potential price movement as traders react to the adjusted earnings narrative, even as the underlying top-line strength persists.
The dual dynamic of rising expenses and a constrained margin underscores the need for disciplined cost management and efficiency improvements. It also highlights the sensitivity of profitability to regulatory shifts and tax policy. In this context, investors should assess the durability of revenue growth against the backdrop of margin normalization opportunities, cost control initiatives, and the potential for export-led upside to supplement domestic performance.
Godfrey Phillips Revenue Composition: Domestic Cigarettes And Exports
Export revenue, driven by unmanufactured tobacco, stood at Rs 248 crore and represented 7% of net sales. This export footprint adds a diversification axis to the revenue mix, potentially offering some cushion against domestic price pressure and regulatory changes. Meanwhile, domestic cigarette sales volume declined 2% YoY in the quarter, signaling that domestic demand remained under pressure even as the brand network and distribution scale support a broad market presence. The 7% export contribution to net sales suggests that the company’s growth thesis partly hinges on overseas markets to sustain top-line momentum while the domestic environment remains challenged.
Understanding the revenue composition is crucial for investors assessing the Godfrey Phillips India stock–the mix between domestic and international revenue streams shapes earnings risk, currency exposure, and the potential for margin stabilization. The company's geographic footprint and portfolio strength will play into how resilient earnings can be if domestic dynamics stall and export markets outperform expectations.
Tax Burden, Illicit Trade And The Stock Narrative
The management commentary underscores a critical macro factor shaping profitability: the tax environment. The report notes that the higher tax burden has not only impacted industry profitability but also contributed to the growth of illicit trade, a significant concern for the legal cigarette industry. For investors, this translates into a nuanced risk: while brand resilience and distribution strength provide some offset, policy risk remains a material determinant of future earnings. The stock narrative will likely hinge on how effectively the company can navigate regulatory changes, control costs, and sustain export momentum to shield margins from tax-driven headwinds.
What Retail Investors Should Watch For Godfrey Phillips Stock Price Movements
Retail investors assessing the Godfrey Phillips stock price should monitor several intertwined signals. First, margin recovery is key: if the gross margin can stabilize around or above the 8–9% band with controlled cost growth, earnings quality could improve even if revenue growth slows. Second, export performance and currency dynamics will influence the top line and profitability, given the 7% export share of net sales. Third, the domestic regulatory regime and enforcement of illicit trade controls will remain a dominant risk factor shaping future profitability and competitive dynamics. Finally, the stock’s momentum will respond to how the market prices these evolving fundamentals in relation to the underlying cash flow generation and balance-sheet health. For a deeper, data-driven view, consider Swastika's Sarthi AI stock assistant to compare Godfrey Phillips India stock fundamentals with peers and benchmarks.
As you assess value, growth, and downside risks, a disciplined approach to monitoring earnings quality over time–rather than chasing short-term price moves–will serve retail investors best. The Godfrey Phillips Share Price narrative is not a one-off reaction to a single quarter; it is a reflection of evolving regulatory, currency, and consumer dynamics that shape a multi-quarter performance trajectory.
Godfrey Phillips India Stock: Global Footprint And Strategic Position
Godfrey Phillips sits as the flagship company of the KK Modi Group, a Fortune 500 organisation with a significant market footprint across Latin America, the Middle East, Southeast Asia, and Eastern Europe, spanning around 30 countries. This global presence offers the company exposure to diverse regulatory environments and consumer preferences, which can help diversify risk and potentially support long-term growth even when domestic dynamics are challenging. Investors often weigh this international dimension against the domestic headwinds, considering how cross-border revenue streams and brand equity can contribute to a resilient earnings profile over the medium term.
Related Reads
- Pvr Inox Share Price Signals And The White Marubozu Burst: Bullish Setup Across Nifty500 Stocks
- CreditAccess Grameen Share Price Momentum: NSE Volume Surges And Retail Investor Insight
Frequently Asked Questions
What were Godfrey Phillips' Q1 FY27 revenue and gross margin?
Q1 FY27 revenue (gross revenue) was Rs 3,820 crore, and the gross profit margin contracted to 7.8% from 15.3% a year earlier.
What portion of net sales came from exports in Q1 FY27?
Exports of unmanufactured tobacco stood at Rs 248 crore, accounting for 7% of net sales.
Did domestic cigarette sales volume rise or fall in Q1 FY27?
Domestic cigarette sales volume slipped by 2% year on year in the quarter.
What management comment was made about tax burden and illicit trade?
The management stated that the higher tax burden has not only impacted industry profitability but also contributed to the growth of illicit trade, a significant concern for the legal cigarette industry.
What is Godfrey Phillips' corporate profile and geographic footprint?
Godfrey Phillips is the flagship company of the KK Modi Group, a Fortune 500 organisation with a presence across Latin America, the Middle East, Southeast Asia and Eastern Europe in around 30 countries.
Conclusion
In the near term, the Q1 FY27 print for Godfrey Phillips suggests a mixed setup: strong topline momentum and a meaningful margin compression driven by regulatory costs and tax considerations. For the retail investor, the key takeaway is to watch how the company leverages its export mix, brand strength, and distribution network to stabilize earnings and begin a measured margin expansion. The Godfrey Phillips Share Price will likely reflect these dynamics as policy signals, currency movements, and commodity costs weave through quarterly results.

DLF Share Price Drives Real Estate Rally As Nifty Clears 24,000
Key Takeaways
- DLF Share Price moved the market beyond 24,000 as the Nifty Realty index advanced.
- Lodha Developers, DLF, and Godrej Properties led Realty gains while Anant Raj and Sobha declined.
- Coforge stock price jumped on strong Q1 FY27 results; Tilaknagar Industries stock fell on softer profits.
- Global cues remain mixed ahead of the Fed decision with oil and yields hovering near key levels.
DLF Share Price sparked the latest market push as the Nifty traded decisively above the 24,000 level. As of 11:30 IST, Sensex stood at 76,895.39, up 59.61 points (0.08%), while Nifty 50 hovered at 24,013.45, up 16.55 points (0.07%). The Nifty Realty index climbed to 918.35, a gain of 1.82%, continuing a two-session up-move that has delivered a 4.14% rise in realty names over the last two sessions. The broader market breadth remained mixed with 1,588 stocks advancing, 2,264 declining, and 246 unchanged, underscoring a selective rally rather than a sweeping market-wide move.
Realty movers stole the limelight, with Lodha Developers up 7.63%, DLF up 1.83%, and Godrej Properties up 1.57%. Aditya Birla Real Estate rose 0.93%, Brigade Enterprises gained 0.63%, and Prestige Estates Projects advanced 0.45%. On the downside, Anant Raj slipped 1.38%, Sobha fell 1.16%, and Oberoi Realty declined 0.72%. The dispersion within the realty complex suggests a bifurcated price action where quality execution stories outperformed, even as some developers faced profit-taking pressure.
In the spotlight stock Indus Towers, consolidated PAT rose to Rs 1,745.8 crore from Rs 1,736.8 crore YoY; revenue from operations stood at Rs 8,431.1 crore, up 4.64% YoY to Rs 8,431.1 crore from Rs 8,057.6 crore. This paints a picture of a telecom infrastructure sector still delivering steady growth amid macro headwinds. Coforge stock price surged 9.57% to Rs 1,674.70 as the company posted Q1 FY27 net profit of Rs 518.60 crore, up 63.4% YoY but down 15.3% QoQ for the quarter ended 30 June 2026.
Tilaknagar Industries, however, declined 4.06% to Rs 428.50, with Q1 FY27 net profit at Rs 31.59 crore, down 64.30% YoY from Rs 88.50 crore. Revenue from operations (excl. excise duty) was Rs 1,046.03 crore in Q1 FY27, up 165.54% YoY from Rs 393.92 crore in Q1 FY26. These company-level dynamics illustrate how earnings quality and sectoral shifts can coexist with a broader market rally, especially when the macro backdrop remains uncertain.
From a macro perspective, global markets offered a mixed backdrop. South Korea's Kospi plunged nearly 8% as investors weighed a Federal Reserve decision due later in the week. Fed funds futures priced in a quarter-point hike in September, according to the CME FedWatch Tool. The week ahead includes Coca Cola, UPS, Corning, and Boeing results before the bell, which could set the tone for global risk sentiment. In commodities and fixed income, Brent crude traded below $90 per barrel, while the U.S. 10-year Treasury yield hovered around 4.65%. U.S. equities offered a choppy session: S&P 500 edged up 0.02% to 7,413.18, Nasdaq slipped 0.18% to 24,932.08, and Dow added 0.51% to 52,210.08.
These cross-currents imply that Indian markets may continue to test the 24,000 level, with the realty complex acting as a key barometer for risk appetite. For investors tracking specific stock ideas, the narrative remains constructive for select developers with delivery execution, strong balance sheets, and visible order inflows. Traders should stay alert to any shifts in global liquidity, as well as domestic policy cues that could alter funding costs and valuations in the coming weeks. If you want to dive deeper into stock-level insights, Swastika's Sarthi AI stock assistant can help you tailor a research plan to your risk tolerance and time horizon: Swastika's Sarthi AI stock assistant.
DLF Share Price And Nifty 24,000 Move: What This Means For Retail Investors
The day’s price action reinforces a pattern that many retail investors track: when a heavyweight name like DLF contributes to a macro-friendly move, the whole realty pack tends to follow. While DLF’s exact intraday move isn’t published in this feed beyond the overall index gains, the positive breadth in realty stocks suggests buyers are prioritizing earnings visibility and project delivery timelines. For a value-conscious reader, the critical takeaway is to watch for how the DLF share price behaves near resistance around the 330–350 range (illustrative levels used for context) and to monitor catalysts such as new project announcements and land monetization updates, as these tend to drive multi-quarter upside in large developers.
Godrej Properties Stock Price Momentum In The Real Estate Rally
Godrej Properties stock price has been a point of focus as the sector recovers. With Lodha Developers and DLF registering strong intraday advances, Godrej Properties has shown resilience amid volatile flows. Investors should track how the stock price behaves with macro news and corporate updates, including sales bookings and new project launches. A steady march higher in this stock often signals improved market sentiment toward mid-to-large cap developers with diversified project pipelines and prudent capital management.
Coforge Stock Price Surge: What It Signals For Growth Or Valuation
Coforge stock price surged on the back of a robust Q1 FY27 performance, with net profit rising 63.4% YoY to Rs 518.60 crore, even as QoQ results cooled by 15.3%. The company posted a quarterly figure that translates into growth that could support a higher multiple if the trajectory sustains. For growth-oriented investors, Coforge represents a potential upside play in the tech services space, provided that the next quarter maintains or accelerates revenue growth and margin expansion while managing costs.
Indus Towers Stock And The Real Estate/Telecom Crosscurrents: PAT And Revenue Trends
Indus Towers stock is not a direct price move in this excerpt, but the company’s profitability and revenue growth matter because telecom infrastructure plays a pivotal role in enabling connected real estate and digital adoption. PAT rose to Rs 1,745.8 crore YoY, while revenue from operations climbed 4.64% YoY to Rs 8,431.1 crore. The strength here reinforces a broader trend: infrastructure enablement is a critical factor behind property developers’ growth narratives, particularly for integrated townships and commercial-cum-residential projects that rely on reliable telecom and data networks.
Lodha Developers Stock And Other Realty Movers: Winners And Losers
Lodha Developers stock led the pack with a 7.63% rise, while DLF and Godrej Properties followed with gains of 1.83% and 1.57% respectively. Brigade Enterprises and Prestige Estates Projects also posted modest but meaningful gains. On the negative side, Anant Raj, Sobha, and Oberoi Realty faced declines of 1.38%, 1.16%, and 0.72% respectively. This dispersion highlights the importance of stock-specific catalysts such as project execution progress, land acquisitions, and margins on new launches, rather than broad sector moves alone.
Tilaknagar Industries Stock: Mixed Signals In Q1 FY27
Tilaknagar Industries declined 4.06% to Rs 428.50 as Q1 FY27 results showed net profit of Rs 31.59 crore, down 64.30% YoY from Rs 88.50 crore. Revenue from operations (excl. excise duty) rose to Rs 1,046.03 crore in Q1 FY27, up 165.54% YoY from Rs 393.92 crore in Q1 FY26. The stock’s move suggests that the market is discounting near-term profitability despite revenue growth, pointing to potential risks in consumer-oriented segments that face margin pressures in the current commodity environment.
What Global Cues Are Shaping Indian Markets Right Now?
Global cues are guiding the risk appetite of Indian traders. Kospi’s near-8% dive reflects risk-off sentiment in Asia, even as investors await the Federal Reserve’s decision due Wednesday. Fed funds futures pricing in a possible quarter-point hike in September implies expectations of a slow but steady normalization of monetary policy. In the commodity space, Brent crude staying below $90 and U.S. 10-year yields around 4.65% add to the backdrop of macro uncertainty. In the U.S., S&P 500 rose 0.02%, Nasdaq fell 0.18%, and Dow gained 0.51%, illustrating a mixed but constructive global frame for risk assets.
Related Reads
- Coforge Share Price Momentum: RSI Uptrend Across Five Nifty500 Stocks
- Wipro Share Price And This Week's Corporate Actions: A Retail Investor's Guide
- Coal India Share Price Outlook After Q1 FY27 Earnings Preview
Frequently Asked Questions
What moved the Nifty above 24,000 in the latest session?
A combination of gains in the Nifty Realty index and revival in realty stocks, led by Lodha Developers, DLF, and Godrej Properties, helped push the market past 24,000. As of 11:30 IST, Sensex was 76,895.39 and Nifty 50 was 24,013.45, with the Realty index at 918.35.
Which realty stocks led the gains and which declined?
Lodha Developers up 7.63%, DLF up 1.83%, and Godrej Properties up 1.57% led the gains. Aditya Birla Real Estate, Brigade Enterprises, and Prestige Estates Projects added smaller gains. Anant Raj (-1.38%), Sobha (-1.16%), and Oberoi Realty (-0.72%) were among the decliners.
What were Coforge and Tilaknagar Industries’ latest results?
Coforge stock price rose 9.57% to Rs 1,674.70 after Q1 FY27 net profit of Rs 518.60 crore, up 63.4% YoY but down 15.3% QoQ. Tilaknagar Industries fell 4.06% to Rs 428.50; Q1 FY27 net profit was Rs 31.59 crore, down 64.30% YoY, while revenue from operations (excl. excise) was Rs 1,046.03 crore, up 165.54% YoY.
What are the key metrics for Indus Towers?
Indus Towers reported PAT of Rs 1,745.8 crore (YoY) and revenue from operations of Rs 8,431.1 crore, up 4.64% YoY from Rs 8,057.6 crore.
What global cues are shaping Indian markets currently?
Investors are watching for the Federal Reserve decision due Wednesday. Kospi plunged nearly 8%, Brent crude stayed below $90, and U.S. 10-year yields hovered around 4.65%. The S&P 500 edged up, while Nasdaq and Dow moved differently, reflecting a mixed global backdrop that can influence domestic risk appetite.
Conclusion
The market’s current pulse suggests a cautious optimism: a credible rally in realty names can sustain if earnings visibility and project pipelines remain intact while macro uncertainties lessen. For a retail investor, the signal is clear–use the 24,000 level as a reference point, monitor the realty leaders for signal strength, and prepare to adjust exposure as earnings signals evolve. One practical mental model is to pair stock-specific catalysts (like project launches, land acquisitions, and cost controls) with macro hooks (Fed decisions, oil, and yields) to decide when to add or trim exposure to real estate and related plays.
Open your trading and demat account here
Reference :
Big Budget


Popular Articles


.avif)
.avif)

.avif)


START YOUR INVESTMENT JOURNEY
Get personalized advice from our experts
- Dedicated RM Support
- Smooth and Fast Trading App
