
Stock Market Today (3 August 2026): Market Setup, Stocks to Watch, Q1 Results, Stocks in News & Nifty Outlook


The Indian stock market today is expected to begin on a positive note as global cues remain supportive. According to today's market setup, the Dow Jones closed higher, Dow futures are trading in the green, and GIFT Nifty indicates a firm opening for the Indian stock market today. Traders tracking the stock market NSE BSE Nifty 50, share market news live, daily market update, and current stock market trends should keep an eye on key technical levels, earnings announcements, and company-specific developments.
Today's Trader's Breakfast covers the market outlook today, stocks to watch today, stocks in news today, Q1 results today, and the important technical levels for Nifty and Bank Nifty. If you're looking for the latest stock news, market movement, share market live status, or Indian share market latest news, here's everything you need to know before the opening bell.
TRY SARTHI - YOUR AI STOCK ASSISTANT
Key Takeaways
- Global cues remain positive with Dow Jones closing higher and GIFT Nifty indicating a positive start.
- FIIs remained net buyers in the cash market.
- Nifty is expected to open near the 24,530-24,600 resistance zone.
- Concord Biotech, Chola Finance, and Ashok Leyland are the stocks to watch today.
- Several companies, including DLF, IREDA, KEI, UPL, CAMS, and PNC, will announce their Q1 earnings today.
- NCC, Maruti, PNC Infratech, and Hero Moto are among the major stocks in news today.
Watch Today's Complete Market Outlook
Stay updated with today's complete Trader's Breakfast for the latest Indian stock market news today, market outlook today, Nifty outlook, stock market update today, and expert analysis from Santosh Meena, Head of Research, Swastika Investmart.
Market Setup Today (3 August 2026)
Global Markets
Global cues remain supportive for the Indian stock market.
- US markets ended higher, with the Dow Jones gaining 276 points.
- Dow futures are trading 246 points higher.
- Asian markets are trading on a mixed note.
- GIFT Nifty: +164 points, indicating a positive opening for the share market today in India.
Cash Market
- FII: +₹277 crore
- DII: +₹2,260 crore
- Net: +₹2,537 crore
F&O Data
- Nifty PCR: 1.29 vs 1.26
- India VIX: 11.76 (-3.29%)
- Highest OI (4 Aug 2026): 24,600 CE & 24,000 PE
- Max Pain (4 Aug 2026): 24,350
FII Derivatives Position
- Future Long: +326
- Future Short: -13,173
- Call Long: +27,717
- Call Short: +35,957
- Put Long: +109,958
- Put Short: +96,913
Interpretation: FII positioning in index derivatives remains mixed to positive.
Technical Outlook
Nifty (Spot)
- Nifty is likely to open in the 24,530-24,600 resistance zone.
- Above 24,600, the next target is the 200-DMA near 24,775.
- Following the expected gap-up opening, 24,430-24,380 will act as the immediate support zone.
Bank Nifty (Spot)
- Immediate resistance: 57,800-58,200
- Above 58,200, the next hurdle is 58,600.
- Immediate supports remain at 57,300 and 56,800.
Stocks to Watch Today
Concord Biotech
Concord Biotech remains one of the stocks to watch today from a positional perspective. According to Santosh Meena, the company is expected to benefit from the positive rub-off effect of encouraging results from Divi's. Technically, the stock has witnessed a strong breakout from a bullish pattern, supported by strong quarterly numbers.
Key Levels
- Positional upside target: ₹1,700
- Important support: ₹1,333
This idea is intended for positional traders rather than day traders.
Chola Finance
Chola Finance continues to display strong technical momentum. The stock has broken out of a flag formation with healthy volumes and is trading near its all-time highs. Positive auto sales data is also expected to support financing companies such as Chola Finance.
Key Levels
- Breakout confirmation: Above ₹1,875
- Upside target: ₹2,000
- Immediate support: ₹1,800
Among today's stocks to watch for today, Chola Finance remains on the radar for momentum traders.
Ashok Leyland
Ashok Leyland is another important stock to watch today. The company reported strong auto sales numbers. Technically, the stock is forming a classical inverse head-and-shoulders pattern and is expected to open above its 200-day moving average.
Key Levels
- Upside potential: ₹200
- The stock had corrected following its previous quarterly results, but the recent sales data has improved the overall outlook.
Stocks in News Today
NCC
NCC secured three orders worth ₹1,052.71 crore during July, including ₹590.38 crore in the Buildings Division and ₹462.33 crore in the Water Division.
Maruti
Maruti Suzuki India reported total sales of 2.41 lakh units, surpassing the market estimate of 2.20 lakh units, representing 33.7% YoY growth.
PNC Infratech
PNC Infratech received a Letter of Intent from the Airports Authority of India for an EPC contract worth ₹302.44 crore for development work at Pantnagar Airport in Uttarakhand. The project is expected to be completed within 24 months.
Hero Moto
Hero Moto launched the VIDA VX2 Go electric scooter, expanding its EV portfolio with multiple charging options. The introductory price starts at ₹1.13 lakh.
Q1 Results Today
Frequently Asked Questions (FAQs)
What is the market outlook for today?
The current market setup indicates a positive opening, supported by higher US markets, positive Dow futures, and a strong GIFT Nifty.
Which are the stocks to watch today?
According to today's Trader's Breakfast, the key stocks to watch are Concord Biotech, Chola Finance, and Ashok Leyland.
Which stocks are in news today?
NCC, Maruti, PNC Infratech, and Hero Moto are among the major stocks making headlines today.
Which companies will announce Q1 results today?
Major companies scheduled to report include CAMS, DLF, IREDA, KEI, UPL, DOMS, Escorts, INOX India, Nazara, PNC, SBI Funds, and Torrent Power.
Over to You
Start your trading day with Trader's Breakfast, your daily source for the latest stock news, Indian stock market news today, market outlook today, Nifty updates, share market live updates, and stocks to watch today.
Santosh Meena, Head of Research at Swastika Investmart, shares the key technical levels, important market developments, and actionable stocks to help you stay informed before the market opens.
For more daily stock market updates, share market news, market movement, and expert insights, stay connected with Swastika Investmart.
Latest Articles
Stock Market Today (3 August 2026): Market Setup, Stocks to Watch, Q1 Results, Stocks in News & Nifty Outlook


The Indian stock market today is expected to begin on a positive note as global cues remain supportive. According to today's market setup, the Dow Jones closed higher, Dow futures are trading in the green, and GIFT Nifty indicates a firm opening for the Indian stock market today. Traders tracking the stock market NSE BSE Nifty 50, share market news live, daily market update, and current stock market trends should keep an eye on key technical levels, earnings announcements, and company-specific developments.
Today's Trader's Breakfast covers the market outlook today, stocks to watch today, stocks in news today, Q1 results today, and the important technical levels for Nifty and Bank Nifty. If you're looking for the latest stock news, market movement, share market live status, or Indian share market latest news, here's everything you need to know before the opening bell.
TRY SARTHI - YOUR AI STOCK ASSISTANT
Key Takeaways
- Global cues remain positive with Dow Jones closing higher and GIFT Nifty indicating a positive start.
- FIIs remained net buyers in the cash market.
- Nifty is expected to open near the 24,530-24,600 resistance zone.
- Concord Biotech, Chola Finance, and Ashok Leyland are the stocks to watch today.
- Several companies, including DLF, IREDA, KEI, UPL, CAMS, and PNC, will announce their Q1 earnings today.
- NCC, Maruti, PNC Infratech, and Hero Moto are among the major stocks in news today.
Watch Today's Complete Market Outlook
Stay updated with today's complete Trader's Breakfast for the latest Indian stock market news today, market outlook today, Nifty outlook, stock market update today, and expert analysis from Santosh Meena, Head of Research, Swastika Investmart.
Market Setup Today (3 August 2026)
Global Markets
Global cues remain supportive for the Indian stock market.
- US markets ended higher, with the Dow Jones gaining 276 points.
- Dow futures are trading 246 points higher.
- Asian markets are trading on a mixed note.
- GIFT Nifty: +164 points, indicating a positive opening for the share market today in India.
Cash Market
- FII: +₹277 crore
- DII: +₹2,260 crore
- Net: +₹2,537 crore
F&O Data
- Nifty PCR: 1.29 vs 1.26
- India VIX: 11.76 (-3.29%)
- Highest OI (4 Aug 2026): 24,600 CE & 24,000 PE
- Max Pain (4 Aug 2026): 24,350
FII Derivatives Position
- Future Long: +326
- Future Short: -13,173
- Call Long: +27,717
- Call Short: +35,957
- Put Long: +109,958
- Put Short: +96,913
Interpretation: FII positioning in index derivatives remains mixed to positive.
Technical Outlook
Nifty (Spot)
- Nifty is likely to open in the 24,530-24,600 resistance zone.
- Above 24,600, the next target is the 200-DMA near 24,775.
- Following the expected gap-up opening, 24,430-24,380 will act as the immediate support zone.
Bank Nifty (Spot)
- Immediate resistance: 57,800-58,200
- Above 58,200, the next hurdle is 58,600.
- Immediate supports remain at 57,300 and 56,800.
Stocks to Watch Today
Concord Biotech
Concord Biotech remains one of the stocks to watch today from a positional perspective. According to Santosh Meena, the company is expected to benefit from the positive rub-off effect of encouraging results from Divi's. Technically, the stock has witnessed a strong breakout from a bullish pattern, supported by strong quarterly numbers.
Key Levels
- Positional upside target: ₹1,700
- Important support: ₹1,333
This idea is intended for positional traders rather than day traders.
Chola Finance
Chola Finance continues to display strong technical momentum. The stock has broken out of a flag formation with healthy volumes and is trading near its all-time highs. Positive auto sales data is also expected to support financing companies such as Chola Finance.
Key Levels
- Breakout confirmation: Above ₹1,875
- Upside target: ₹2,000
- Immediate support: ₹1,800
Among today's stocks to watch for today, Chola Finance remains on the radar for momentum traders.
Ashok Leyland
Ashok Leyland is another important stock to watch today. The company reported strong auto sales numbers. Technically, the stock is forming a classical inverse head-and-shoulders pattern and is expected to open above its 200-day moving average.
Key Levels
- Upside potential: ₹200
- The stock had corrected following its previous quarterly results, but the recent sales data has improved the overall outlook.
Stocks in News Today
NCC
NCC secured three orders worth ₹1,052.71 crore during July, including ₹590.38 crore in the Buildings Division and ₹462.33 crore in the Water Division.
Maruti
Maruti Suzuki India reported total sales of 2.41 lakh units, surpassing the market estimate of 2.20 lakh units, representing 33.7% YoY growth.
PNC Infratech
PNC Infratech received a Letter of Intent from the Airports Authority of India for an EPC contract worth ₹302.44 crore for development work at Pantnagar Airport in Uttarakhand. The project is expected to be completed within 24 months.
Hero Moto
Hero Moto launched the VIDA VX2 Go electric scooter, expanding its EV portfolio with multiple charging options. The introductory price starts at ₹1.13 lakh.
Q1 Results Today
Frequently Asked Questions (FAQs)
What is the market outlook for today?
The current market setup indicates a positive opening, supported by higher US markets, positive Dow futures, and a strong GIFT Nifty.
Which are the stocks to watch today?
According to today's Trader's Breakfast, the key stocks to watch are Concord Biotech, Chola Finance, and Ashok Leyland.
Which stocks are in news today?
NCC, Maruti, PNC Infratech, and Hero Moto are among the major stocks making headlines today.
Which companies will announce Q1 results today?
Major companies scheduled to report include CAMS, DLF, IREDA, KEI, UPL, DOMS, Escorts, INOX India, Nazara, PNC, SBI Funds, and Torrent Power.
Over to You
Start your trading day with Trader's Breakfast, your daily source for the latest stock news, Indian stock market news today, market outlook today, Nifty updates, share market live updates, and stocks to watch today.
Santosh Meena, Head of Research at Swastika Investmart, shares the key technical levels, important market developments, and actionable stocks to help you stay informed before the market opens.
For more daily stock market updates, share market news, market movement, and expert insights, stay connected with Swastika Investmart.

Nifty 50 31 Jul 2026 Morning Market Summary
Key Takeaways
- Prev session close reference: Nifty 50 Pivot 24370.9; R1 24442.1; R2 24500.6; S1 24312.4; S2 24241.2.
- Standout mover: TRANSPEK from 1101.1 -> 1321.3 (+20.00%).
- Biggest loser: NARMADA from 36.19 -> 17.02 (-52.97%).
- Market-wide Index Options PCR: Not available for this session.
Nifty 50 Support And Resistance Levels For 31 Jul 2026
Pivot: 24370.9; R1: 24442.1; R2: 24500.6; S1: 24312.4; S2: 24241.2. The Pivot is the central reference; R1 and R2 above are resistance hurdles, while S1 and S2 below are cushions. All these numbers come from yesterday's close as the basis for today's session.
In plain language, if the price sits above R1, the near-term tone is mildly bullish; above R2, the bias could extend higher; if it slips below S2, the bias could turn bearish. For deeper stock-level insights, Swastika's Sarthi AI stock assistant.
Nifty Bank Pivot Levels For 31 Jul 2026
Pivot: 57271.9; R1: 57404.2; R2: 57543.55; S1: 57132.55; S2: 57000.25. Those levels mirror the same logic as Nifty 50 for the Bank Nifty.


Top 5 Gainers (31 Jul 2026 Session, EQ Series, Liquid Names Only)
| Ticker | From | To | Change |
|---|---|---|---|
| TRANSPEK | 1101.1 | 1321.3 | (+20.00%) |
| UEL | 128.11 | 153.73 | (+20.00%) |
| YASHO | 3215.6 | 3858.7 | (+20.00%) |
| RSDFIN | 92.29 | 110.74 | (+19.99%) |
| DCI | 276.75 | 329.7 | (+19.13%) |
Top 5 Losers (31 Jul 2026 Session, EQ Series, Liquid Names Only)
| Ticker | From | To | Change |
|---|---|---|---|
| NARMADA | 36.19 | 17.02 | (-52.97%) |
| EXPLEOSOL | 906.6 | 802.85 | (-11.44%) |
| THANGAMAYL | 5807.0 | 5226.5 | (-10.00%) |
| ASIANTILES | 60.71 | 54.68 | (-9.93%) |
| SIGNPOST | 311.2 | 283.55 | (-8.88%) |
Market-Wide Index Options PCR
Market-wide Index Options PCR: Not available for this session.
Frequently Asked Questions
Nifty 50 Support and Resistance Levels for 31 Jul 2026
Pivot 24370.9; R1 24442.1; R2 24500.6; S1 24312.4; S2 24241.2. These are reference points for today's trading, derived from yesterday's close.
Nifty Bank Pivot Levels for 31 Jul 2026
Pivot 57271.9; R1 57404.2; R2 57543.55; S1 57132.55; S2 57000.25. These are yesterday's close-based reference levels for today.
Top Gainers on 31 Jul 2026
TRANSPEK: 1101.1 -> 1321.3 (+20.00%); UEL: 128.11 -> 153.73 (+20.00%); YASHO: 3215.6 -> 3858.7 (+20.00%); RSDFIN: 92.29 -> 110.74 (+19.99%); DCI: 276.75 -> 329.7 (+19.13%).
Top Losers on 31 Jul 2026
NARMADA: 36.19 -> 17.02 (-52.97%); EXPLEOSOL: 906.6 -> 802.85 (-11.44%); THANGAMAYL: 5807.0 -> 5226.5 (-10.00%); ASIANTILES: 60.71 -> 54.68 (-9.93%); SIGNPOST: 311.2 -> 283.55 (-8.88%).
PCR for Market-wide Index Options today
Market-wide Index Options PCR: Not available for this session.
Conclusion
Yesterday's close reference levels set the stage for today's open. Nifty 50 pivot at 24370.9 with R1 24442.1 and R2 24500.6; S1 24312.4; S2 24241.2. The standout mover TRANSPEK posted a 20% gain while NARMADA slid 52.97% from 36.19 to 17.02. Market-wide Index Options PCR remains not available for this session. Watch how price interacts with the pivot and resistance/support on open, and consider exploring deeper stock-level insights with Swastika's Sarthi AI stock assistant.
Open your trading and demat account here
Reference :
1 : Nseindia

SEBI Closing Auction Session (CAS): Everything Investors & Traders Need to Know
Key Takeaways
- SEBI's Closing Auction Session (CAS) comes into effect from August 3, 2026, for eligible F&O stocks in the equity cash segment.
- The official closing price will now be determined through a single-price auction rather than the existing 30-minute VWAP methodology.
- Continuous trading for eligible stocks will end at 3:15 PM, followed by a structured 20-minute auction session.
- The new framework aims to improve price discovery, reduce end-of-day price manipulation, and align Indian markets with global exchanges like the NYSE and LSE.
- Intraday traders, investors, ETFs, mutual funds, and F&O participants should understand the revised market timings and order rules before trading.


What is the SEBI Closing Auction Session (CAS)?
The Closing Auction Session (CAS) is a new market mechanism introduced by the Securities and Exchange Board of India (SEBI) to determine the official closing price of eligible stocks through an auction-based process. Instead of calculating the closing price using the Volume Weighted Average Price (VWAP) of the final 30 minutes of trading, SEBI will now collect buy and sell orders during a dedicated auction window and determine a single equilibrium price where the maximum number of shares can be traded.
The objective is simple: make the closing price more transparent, efficient, and resistant to manipulation. Initially, the framework applies to stocks that have active derivatives (F&O) contracts, while other securities will continue using the existing methodology until further phases are introduced.
TRY SARTHI - YOUR AI STOCK ASSISTANT
Why is SEBI Changing the Closing Price Method?
The closing price is one of the most important numbers in the stock market. It is used for:
- Settlement of derivatives
- Mutual fund portfolio valuation
- ETF benchmarking
- Index calculation
- Institutional portfolio valuation
- Daily mark-to-market calculations
Under the previous system, the closing price was determined using the VWAP of trades executed between 3:00 PM and 3:30 PM.
Although effective, this approach could still be influenced by large trades placed during the final few minutes of trading. Institutional orders or sudden spikes in buying or selling sometimes affected the closing value, particularly in highly liquid stocks.
The Closing Auction Session pools all eligible orders together and discovers one common closing price, making the process significantly more transparent.
Old vs New Closing Price System
For traders, this is one of the biggest structural changes in India's equity market in recent years.
How the Closing Auction Session Works
The Closing Auction Session follows a structured timeline after regular market trading ends.
Unlike continuous trading, the auction does not execute trades immediately. Instead, all eligible orders are collected first and matched together once the auction closes. This allows the exchange to determine the fairest possible closing price.
What is the Reference Price?
The Reference Price acts as the starting point for the auction. For actively traded securities, it is calculated using the VWAP between 3:00 PM and 3:15 PM. If a stock has not traded during this period, the exchange follows fallback rules:
- The day's Last Traded Price (LTP) may be used.
- If the stock has not traded during the day, the previous adjusted closing price serves as the reference.
- Corporate actions are also considered while determining the adjusted reference price.
This reference price also determines the ±3% price band within which auction orders are eligible for execution. This ensures that the auction remains orderly and prevents abnormal price movements during closing.
How is the Equilibrium Price Determined?
The official closing price is known as the Equilibrium Price. The exchange identifies the price where the maximum executable quantity can be matched between buyers and sellers. Rather than looking at individual trades, the exchange analyses the complete order book. For every possible price level, it calculates:
- Total cumulative buy quantity
- Total cumulative sell quantity
- Maximum executable volume
The price with the highest executable quantity becomes the equilibrium price. This method allows the market to discover a closing price based on the collective demand and supply of all participants rather than a few last-minute trades.
How Does the Exchange Break a Tie?
Sometimes, more than one price may produce the same executable trading volume during the auction. In such cases, the exchange follows a predefined tie-breaking process to ensure fairness.
Minimum Order Imbalance
The exchange first selects the price that leaves the smallest unmatched quantity between buyers and sellers.
Closest to the Reference Price
If two prices still qualify, the price closest to the reference price is selected.
Reference Price Becomes the Closing Price
If the tie still cannot be resolved, or if the reference price lies exactly between two eligible prices, the reference price itself becomes the official closing price. These predefined rules eliminate subjectivity and ensure that every participant understands how the final closing price is determined.
Which Stocks Will Be Covered Under CAS?
During the initial rollout starting August 3, 2026, the closing auction session applies only to equity cash-segment stocks with active Futures & Options (F&O) contracts. These stocks generally have:
- High trading volumes
- Better liquidity
- Greater institutional participation
Stocks outside the F&O segment will continue with the existing VWAP-based closing price calculation, and continuous trading for these securities will continue until 3:30 PM. SEBI has indicated that the framework may be extended to more securities in future phases after evaluating its effectiveness.
New Market Timings After August 3, 2026
The introduction of the closing auction session changes how the trading day ends for eligible securities.
Additionally, from September 7, 2026, SEBI will align the pre-open session (9:00 AM–9:15 AM) with a similar auction-based framework, including a random market closure before order matching.
How will the Closing Auction Session Affect Intraday Traders?
Intraday traders are likely to experience the biggest operational changes under the new framework. Since continuous trading for eligible stocks now ends at 3:15 PM, many brokers have revised their intraday auto square-off timings to around 3:00 PM or 3:10 PM, depending on their internal risk policies. This means traders should:
- Exit intraday positions earlier than before.
- Check updated broker square-off timings regularly.
- Avoid waiting until the final few minutes of trading for position management.
It is also important to remember that Stop-Loss orders are not permitted during the Closing Auction Session. Any pending stop-loss orders from the continuous session are automatically cancelled when the auction begins.
Similarly, Iceberg Orders and Immediate-or-Cancel (IOC) orders are not allowed during the auction. Understanding these changes can help traders avoid unexpected order cancellations or execution issues.
Impact on F&O Traders
Although trading in eligible cash market stocks stops at 3:15 PM, equity derivatives continue trading until 3:40 PM. This creates a unique scenario. Between 3:15 PM and 3:35 PM, the underlying cash market is in the auction process while derivative contracts remain tradable.
Once the official closing price is announced around 3:35 PM, F&O traders still have approximately five minutes to:
- Square off positions
- Hedge existing trades
- Carry forward positions
- Adjust expiry-day strategies
The new structure provides better visibility into the confirmed closing price before derivative trading concludes. It also improves the accuracy of settlement prices for stock and index derivatives.
What Happens to Existing Orders?
Many traders wonder whether they need to place fresh orders once the auction begins. The answer depends on the type of order.
Orders Automatically Carried Forward
- Eligible Limit Orders
- Orders within the ±3% price band
These retain their original time priority, giving them preference over newly entered limit orders during the auction.
Orders Automatically Cancelled
- Stop-Loss Orders
- Iceberg Orders
- Orders outside the ±3% price band
- Immediate-or-Cancel (IOC) Orders
If you intend to participate in the auction, you should review your order book before 3:15 PM to understand which orders will remain active.
Order Types Allowed During the Closing Auction
During the second order entry phase (3:25 PM–3:30 PM), only Limit Orders can be placed or modified. Market orders become locked and cannot be changed. This structured process helps maintain orderly price discovery while preventing last-second order manipulation.
How Does the Closing Auction Session Improve Price Discovery?
One of the biggest reasons SEBI has introduced the Closing Auction Session (CAS) is to improve price discovery.
In the previous system, the official closing price depended on the Volume Weighted Average Price (VWAP) of trades executed during the final 30 minutes of the trading session. While this method worked well in most situations, it could still be influenced by unusually large trades placed near the market close.
With the auction mechanism, all eligible buy and sell orders are pooled together and matched simultaneously at a single equilibrium price. This ensures that the closing price reflects the maximum consensus between buyers and sellers instead of being driven by a handful of transactions.
The benefits include:
- Fairer and more transparent closing prices.
- Better representation of actual market demand and supply.
- Reduced impact of large institutional orders.
- Lower chances of end-of-day price distortion.
- Improved confidence among retail and institutional investors.
Why is the Closing Price So Important?
Many investors only focus on the opening price or the live market price, but the closing price plays an equally important role in the financial markets. The official closing price is used for:
Index Calculation
Benchmark indices like the Nifty 50 and BSE Sensex use the official closing prices of their constituent stocks to determine the final index value for the day.
Mutual Fund NAVs
Mutual fund portfolios are valued using the official market closing prices. A more accurate closing price helps determine a fairer Net Asset Value (NAV) for investors.
ETF Performance
Exchange-Traded Funds (ETFs) closely track benchmark indices. A transparent closing price reduces tracking error, allowing ETFs to mirror their benchmarks more accurately.
Derivative Settlement
On expiry days, stock futures and options rely on official closing prices for settlement. A robust auction-based mechanism makes these settlements more reliable.
Portfolio Valuation
Retail and institutional investors also see the value of their portfolios based on official closing prices. More accurate closing prices lead to more reliable portfolio reporting.
Actual Index Value vs Indicative Index Value
During the phased implementation of CAS, not every stock in an index will participate in the auction. As a result, exchanges will disseminate two different index values between 3:15 PM and 3:30 PM.
Actual Index Value
This uses the Last Traded Price (LTP) from the continuous trading session for CAS-eligible stocks and the real-time LTP for stocks still trading normally.
Indicative Index Close Value
This reflects what the index closing value is likely to be after considering:
- Indicative equilibrium prices for CAS stocks.
- VWAP-based calculations for non-CAS securities.
This helps traders monitor how the benchmark may finally close before the auction concludes.
A Simple Example of the Closing Auction Session
Let's understand the process with a simplified example. Suppose ABC Ltd. finishes continuous trading at around ₹1,000. Between 3:20 PM and 3:30 PM, investors submit the following orders:
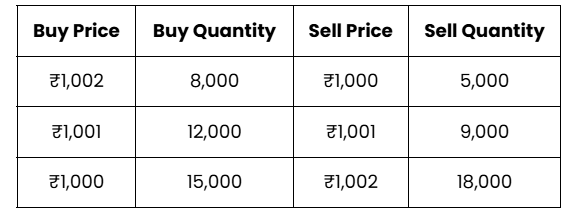
The exchange calculates the cumulative buy and sell quantities at every price level. Suppose the maximum executable quantity is achieved at ₹1,001. In that case:
- ₹1,001 becomes the official closing price.
- All eligible trades execute at this single price.
- Remaining unmatched orders continue as per auction rules or are cancelled if required.
This method produces a closing price based on overall market consensus rather than the last individual trade.
How Does CAS Benefit Different Market Participants?
Retail Investors
Retail investors receive a closing price that is less susceptible to sudden end-of-day volatility. This improves portfolio valuation and reduces confusion caused by sharp price movements in the final seconds of trading.
Institutional Investors
Large institutions often execute high-value trades toward the end of the day for portfolio rebalancing. The auction allows these large orders to be executed more efficiently without significantly impacting market prices.
Mutual Funds and ETFs
Since fund managers rely on official closing prices for valuation and benchmarking, the auction-based mechanism helps reduce pricing inconsistencies and improves fund performance tracking.
Algorithmic Traders
The new framework provides a structured auction process with clearly defined order rules. Algorithmic trading systems can participate in the auction while adapting their execution strategies to the revised timeline.
How Does CAS Align India with Global Markets?
India is not the first country to adopt an auction-based closing mechanism. Many leading global exchanges already use similar systems, including:
- New York Stock Exchange (NYSE)
- London Stock Exchange (LSE)
- Several major European and Asian exchanges
These auction mechanisms have become an accepted global standard because they improve market efficiency, strengthen price discovery, and support institutional trading without creating unnecessary volatility.
With the introduction of the closing auction session, India's equity market moves closer to these internationally accepted market practices while enhancing transparency for all participants.
Advantages of the Closing Auction Session
The closing auction session is more than just a change in market timings. It introduces a more efficient mechanism for determining the official closing price, benefiting retail investors, institutions, and the overall market ecosystem.
Improved Price Discovery
By collecting all buy and sell orders before matching them at a single equilibrium price, CAS ensures that the closing price reflects the actual demand and supply in the market. Instead of relying on trades executed over the last few minutes, the auction considers the collective interest of all participants, leading to a fairer market close.
Reduced Market Manipulation
One of SEBI's primary objectives is to make it more difficult to manipulate closing prices. Under the previous system, aggressive buying or selling near the end of trading could sometimes influence the closing price. Since CAS executes all eligible trades at one auction-discovered price, isolated trades have much less impact. This strengthens market integrity and investor confidence.
Better Execution for Large Orders
Institutional investors, pension funds, insurance companies, and mutual funds frequently execute large orders near the market close. The auction mechanism allows these participants to execute sizeable transactions with minimal market impact, improving liquidity while reducing unnecessary price volatility.
Lower Tracking Error for ETFs and Index Funds
Passive investment products such as ETFs and index funds attempt to replicate benchmark indices. A more accurate official closing price helps these funds closely track their underlying indices, resulting in lower tracking error and improved investment efficiency.
Stronger Global Alignment
Major exchanges such as the New York Stock Exchange (NYSE) and the London Stock Exchange (LSE) have successfully used closing auctions for years. With CAS, India's capital markets adopt globally accepted best practices, making the market more attractive to domestic and international investors.
Challenges Traders Should Know
While the Closing Auction Session offers several long-term advantages, traders should also understand the operational changes that come with the new framework.
Earlier Intraday Square-Off Timings
Since continuous trading for eligible stocks now ends at 3:15 PM, many brokers have revised intraday auto square-off timings to around 3:00 PM–3:10 PM. Traders who fail to adjust their strategies may experience unexpected position closures.
Learning a New Trading Process
Unlike continuous trading, the auction follows different order entry rules, matching logic, and timelines. Investors participating in CAS should familiarise themselves with:
- Order entry windows
- Market order restrictions
- Limit order rules
- Random market closure
- Auction price discovery
Understanding these mechanics can help avoid execution surprises.
Stop-Loss Orders are Not Allowed
One important operational change is that Stop-Loss orders cannot participate in the Closing Auction Session. Any pending stop-loss orders are cancelled before the auction begins.
Traders relying heavily on automated risk management should account for this while planning end-of-day positions.
Multiple Market Closing Timings
The introduction of CAS also creates different closing times for various market segments. For example:
- Eligible cash market stocks stop continuous trading at 3:15 PM.
- Auction concludes around 3:35 PM.
- Equity derivatives continue until 3:40 PM.
Initially, this may require traders to adapt their daily trading routines.
Frequently Asked Questions (FAQs)
What is the Closing Auction Session (CAS)?
The closing auction session is a new mechanism introduced by SEBI to determine the official closing price of eligible stocks through an auction instead of using the last 30-minute VWAP. It comes into effect from August 3, 2026, for selected F&O stocks.
Why has SEBI introduced the Closing Auction Session?
SEBI introduced CAS to improve price discovery, reduce end-of-day price manipulation, facilitate efficient execution of large institutional orders, and align Indian markets with global exchanges.
Which stocks are covered under the Closing Auction Session?
Initially, CAS applies only to equity cash segment stocks with active Futures & Options (F&O) contracts. Other securities will continue using the existing VWAP-based closing price calculation until further phases are introduced.
What is the Reference Price?
The Reference Price is generally the VWAP of trades executed between 3:00 PM and 3:15 PM. It acts as the basis for determining the ±3% auction price band.
What is an Equilibrium Price?
The Equilibrium Price is the single price at which the maximum number of buy and sell orders can be matched during the Closing Auction Session. This price becomes the official closing price of the stock.
Are market orders allowed during the Closing Auction Session?
Yes, market orders are permitted during the first order entry phase (3:20 PM–3:25 PM). During the second phase (3:25 PM–3:30 PM), only limit orders can be placed or modified.
Can I place Stop-Loss or Iceberg Orders during CAS?
No. Stop-Loss, Iceberg, and Immediate-or-Cancel (IOC) orders are not allowed during the Closing Auction Session.
What happens to my pending limit orders?
Eligible limit orders that fall within the prescribed ±3% price band are automatically carried forward into the auction and retain their original time priority.
How does CAS affect F&O traders?
While eligible cash market stocks stop continuous trading at 3:15 PM, equity derivatives continue until 3:40 PM. This gives F&O traders additional time to manage their positions after the official closing price is determined.
Does the Closing Auction Session replace the Post-Close Session?
No. The Post-Close Session continues to operate after the auction and allows eligible trades to be executed at the final discovered closing price.
Final Thoughts
The introduction of the closing auction session marks one of the most significant structural changes in India's equity market in recent years. By replacing the traditional VWAP-based closing price calculation with an auction-driven mechanism, SEBI aims to improve transparency, strengthen price discovery, and create a more efficient closing process for all market participants.
Although traders may need time to adjust to revised market timings, new order rules, and updated broker square-off schedules, the long-term benefits are expected to outweigh the initial learning curve. A more robust closing price mechanism will support better derivative settlements, improve ETF and mutual fund tracking, and reduce the possibility of end-of-day price manipulation.
As Indian markets continue to evolve in line with global standards, understanding regulatory developments like the closing auction session can help investors and traders make more informed decisions.
Whether you're an active trader, a long-term investor, or someone just beginning your investment journey, staying informed about changes in market structure is just as important as tracking stocks. For more insights on market regulations, trading strategies, and investment education, stay connected with Swastika Investmart.

Juniper Green Energy IPO Review 2026: Dates, Price Band, GMP, Financials & Should You Invest?
Juniper Green Energy IPO opens for subscription on July 30, 2026, offering investors an opportunity to participate in one of India's rapidly expanding renewable energy companies. The IPO is a 100% fresh issue worth ₹1,800 crore, with the company planning to utilise the proceeds primarily for debt reduction and strengthening its balance sheet.
As renewable energy continues to remain one of India's fastest-growing sectors, many investors are evaluating whether the Juniper Green Energy IPO can deliver long-term wealth creation despite its premium valuation. This detailed Juniper Green Energy IPO review covers the IPO dates, price band, GMP outlook, financial performance, business strengths, risk factors, valuation, and Swastika Investmart's rating.
TRY SARTHI - YOUR AI STOCK ASSISTANT
Juniper Green Energy IPO Details
About Juniper Green Energy Limited
Juniper Green Energy Limited is one of India's rapidly growing renewable energy companies focused on developing, constructing, owning, and operating utility-scale clean energy projects. Since pivoting into the renewable energy sector in 2018, the company has expanded its footprint significantly and now ranks among the top 10 renewable Independent Power Producers (IPPs) in India by total capacity.
Unlike companies that focus solely on solar power, Juniper Green has built a diversified portfolio spanning solar, wind, wind-solar hybrid (WSH), Firm & Dispatchable Renewable Energy (FDRE), and Battery Energy Storage Systems (BESS). This diversified approach enables the company to participate across multiple segments of India's evolving renewable energy ecosystem.
As of March 31, 2026, Juniper Green had a total renewable energy portfolio of 7,910.20 MWac spread across 50 projects, including operational assets, projects under construction, and awarded projects awaiting execution. The company also operates through 56 project-specific subsidiaries (SPVs) that manage individual renewable energy assets.
A significant portion of its revenue is generated through long-term Power Purchase Agreements (PPAs) with central and state government entities, providing better revenue visibility over the life of its projects.
Juniper Green Energy IPO Objectives
The company intends to utilise the IPO proceeds primarily to reduce its outstanding debt, both at the parent company level and across certain subsidiaries. Lower borrowings are expected to reduce finance costs while improving the company's capital structure and financial flexibility for future expansion. The remaining proceeds will be used for general corporate purposes.
Juniper Green - Business Overview
Juniper Green Energy Limited is among India's leading renewable energy Independent Power Producers (IPPs), developing, constructing, and operating utility-scale solar, wind, hybrid, and Firm & Dispatchable Renewable Energy (FDRE) projects.
The company has built a diversified renewable portfolio across multiple states and benefits from long-term Power Purchase Agreements (PPAs) with government-backed counterparties. With nearly 7.9 GW of total capacity across operational, under-construction, and awarded projects, Juniper Green Energy is positioned to benefit from India's increasing focus on clean energy and decarbonisation.
Its growing investments in Battery Energy Storage Systems (BESS), wind-solar hybrid projects, and advanced renewable infrastructure further strengthen its long-term growth potential. As of March 2026, its portfolio consisted of:
The company has also planned 4,563.88 MWh of Battery Energy Storage System (BESS) capacity, reflecting its strategic focus on next-generation renewable energy infrastructure.
Financial Performance of Juniper Green
Juniper Green has reported healthy revenue growth over the last three financial years as more renewable energy projects became operational. While profitability has remained relatively stable, earnings continue to be influenced by higher finance costs associated with its rapid expansion and capital-intensive business model.
The proposed IPO aims to improve the company's leverage by repaying a significant portion of its outstanding borrowings.
Key Financial Highlights
- Revenue nearly doubled between FY24 and FY26.
- Operating EBITDA witnessed strong growth during the same period.
- Net profit remained stable despite continued investments in expansion.
- Total borrowings stood at over ₹12,920 crore before the IPO.
- Debt-to-equity ratio stood at 3.77 as of March 31, 2026.
Key Operating Metrics About Juniper Green
Beyond financial performance, the company has demonstrated strong operational execution and asset performance.
One notable achievement is the company's ability to commission projects well ahead of schedule, with operational assets completed on average 147 days before their Scheduled Commercial Operation Date (SCOD).
Industry Outlook - Juniper Green Limited
India's renewable energy sector continues to benefit from favourable policy support, rising electricity demand, and increasing investments in sustainable infrastructure. The Government of India has set an ambitious target of achieving 500 GW of non-fossil fuel capacity by 2030, creating significant opportunities for renewable energy developers.
Juniper Green's diversified project pipeline, focus on hybrid renewable solutions, and investments in battery energy storage position the company to benefit from this long-term structural growth. As renewable energy adoption accelerates, developers with large execution pipelines and strong project capabilities are expected to play a key role in meeting the country's energy transition goals.
Strengths of Juniper Green Energy
Juniper Green has built several competitive advantages that support its long-term growth strategy. The company's 7.91 GW renewable energy portfolio makes it one of India's leading renewable IPPs, with projects spanning multiple technologies rather than relying solely on solar power.
Its execution capabilities have also been impressive. Operational projects have been commissioned, on average, 147 days ahead of schedule, demonstrating efficient project planning and execution.
Another key strength is its diversified technology mix. The company has established a balanced portfolio comprising solar, wind, hybrid renewable projects, FDRE solutions, and battery energy storage systems. This diversification reduces dependence on a single renewable technology while improving future growth opportunities.
Long-term Power Purchase Agreements with government-backed utilities further enhance revenue visibility and reduce merchant power price risks. Additionally, the company achieved a 96.8% conversion rate in Wind-Solar Hybrid and FDRE tenders between FY22 and FY26, highlighting its strong bidding capabilities in competitive auctions.
Risk Factors About Juniper Green IPO
While Juniper Green offers an attractive long-term growth story, investors should also consider the associated risks. The company operates in a highly capital-intensive industry and carried substantial borrowings before the IPO. Although the issue proceeds will be used to reduce debt, future expansion may continue to require significant capital investment.
Revenue is also concentrated among a few government-backed electricity distribution companies. Delays in payments from these counterparties could impact working capital and cash flows.
Renewable power generation remains dependent on weather conditions such as solar irradiation and wind speeds, which can affect generation levels. Additionally, regulatory approvals, execution delays, and changes in government policies may impact project timelines and profitability. Lastly, the IPO appears aggressively valued, with a pre-IPO P/E multiple of around 271x, leaving limited room for valuation comfort.
Juniper Green Energy IPO Review - Apply or Avoid
Juniper Green Energy enters the public markets with a strong renewable energy platform, a sizeable project pipeline, and an impressive execution track record. The company has successfully diversified across solar, wind, hybrid, and battery storage projects while securing long-term government-backed PPAs that provide visibility into future revenues.
The primary objective of the IPO is to reduce debt, which should strengthen the balance sheet and lower finance costs over time. Combined with India's favourable renewable energy outlook, this provides a solid foundation for long-term growth.
However, investors should not overlook the challenges. The company continues to operate with high leverage, and the IPO is priced at a premium valuation relative to its current earnings. While the long-term business prospects remain encouraging, the valuation may restrict the potential for immediate listing gains.
Overall, the IPO appears better suited for investors with a long-term investment horizon who believe in India's renewable energy growth story rather than those seeking short-term listing gains.
Reasons to Consider Green Energy Limited
- Top 10 renewable IPP in India
- Large 7.91 GW renewable portfolio
- Strong project execution record
- Long-term government-backed PPAs
- Significant battery storage pipeline
- IPO proceeds focused on debt reduction
- Favourable long-term renewable energy outlook
Key Concerns
- Premium valuation
- High debt levels
- Weather-dependent operations
- Customer concentration
- Capital-intensive business model
- Regulatory and execution risks
Overall View: Juniper Green Energy offers a compelling long-term renewable energy investment opportunity backed by a diversified project portfolio and strong execution capabilities. However, given its elevated valuation and leverage, investors should evaluate the Juniper Green IPO based on their risk appetite and investment horizon rather than expecting substantial short-term listing gains.
Swastika Investmart IPO Rating: SUBSCRIBE FOR LONG TERM
Rating: Neutral
Juniper Green Energy operates in one of India's fastest-growing industries and has built a sizeable renewable energy platform supported by long-term government-backed contracts. The planned debt reduction through the IPO is another positive factor that could strengthen its financial profile.
However, the premium valuation, high leverage, and capital-intensive nature of the business limit the scope for immediate upside. Investors with a long-term investment horizon and confidence in India's renewable energy growth story may consider the IPO, while those seeking short-term listing gains may prefer to remain selective.
Frequently Asked Questions (FAQs)
When will the Juniper Green Energy IPO open?
The IPO will open for subscription on July 30, 2026, and close on August 3, 2026.
What is the price band of the Juniper Green Energy IPO?
The price band has been fixed at ₹214–₹225 per equity share.
What is the minimum lot size?
Retail investors must apply for a minimum of 66 equity shares.
What is the size of the Juniper Green Energy IPO?
The company plans to raise ₹1,800 crore through a 100% fresh issue, with no Offer for Sale component.
How will the IPO proceeds be used?
The proceeds will primarily be used for repaying borrowings of the company and certain subsidiaries, while the remaining amount will be allocated towards general corporate purposes.
Is Juniper Green Energy profitable?
Yes. The company reported a net profit of ₹404.64 million in FY26 while continuing to expand its renewable energy portfolio.
Bottom Line
The Juniper Green Energy IPO presents a compelling long-term investment opportunity backed by a strong renewable energy portfolio, an expanding project pipeline, and favourable industry tailwinds. While the company's debt levels and premium valuation may limit short-term listing gains, its focus on reducing leverage through the IPO and its presence in India's fast-growing clean energy sector support its long-term growth prospects. For more IPO reviews and market insights, stay connected with Swastika Investmart.

Indian Stock Market Today: Market Outlook, Stocks to Watch, Stocks in News & Q1 Results | 31 July 2026
The Indian stock market enters the final trading session of July with positive global cues, strong institutional participation, and several earnings announcements likely to keep market participants engaged. Investors tracking the stock market today India will be closely watching the opening trend, key technical levels, corporate developments, and Q1 earnings for fresh market direction.
In today's daily market update, we cover the complete market setup, stocks to watch today, the latest stocks in news, companies announcing Q1 results today, and the important technical observations shared by Santosh Meena, Head of Research, Swastika Investmart, during Trader's Breakfast. Whether you're following the NSE and BSE, monitoring the Nifty 50, or looking for the latest Indian stock market news today, this report brings together the key updates before the opening bell.
Key Takeaways
- Positive global cues with GIFT Nifty indicating a firm start.
- FIIs remained net buyers in the cash market.
- Nifty continues its upward move while Bank Nifty remains range-bound.
- Three stocks to watch today highlighted during Trader's Breakfast:
- GE Vernova T&D India Ltd
- Hindalco Industries Ltd
- Nykaa
- Four companies remain in focus under today's stocks in news.
- Multiple companies are scheduled to announce Q1 results today.
Watch Today's Complete Market Outlook
Stay updated with today's Trader's Breakfast, where Santosh Meena, Head of Research, Swastika Investmart, discusses the latest Indian stock market outlook today, July 31 2026, global cues, technical outlook, sectoral trends, market movement, and stocks to watch today.
Market Setup Today (31 July 2026)
Global Markets
- US markets ended higher (Dow Jones +614 points).
- Dow Futures are trading higher (+188 points).
- Asian markets are trading on a positive note.
- GIFT Nifty: +70 points.
Cash Market
- FII: +₹3,624 crore
- DII: -₹1,864 crore
- Net: +₹1,760 crore
F&O Data
- Nifty PCR: 1.26 vs 1.18
- India VIX: 12.16 (+1.23%)
- Highest OI (04 Aug 2026): 24600 CE & 24000 PE
- Max Pain (04 Aug 2026): 24250
Interpretation: FII derivatives data remained mixed to positive in F&O.
Technical Outlook
Nifty (Spot)
- Nifty is extending its upward move with 24400 acting as the immediate hurdle.
- 24200 is the immediate support.
- 24080–24000 remains the next key support zone.
- A decisive move above 24400 could open the way towards the 24530–24600 resistance zone.
Bank Nifty (Spot)
- Bank Nifty continues to consolidate within the 56000–58000 range.
- 57300 is the immediate hurdle.
- Above this, 57800–58200 is the next resistance zone.
- 56800, 56500, and 56000 remain the important support levels.
Stocks to Watch Today
The following stocks to watch today were discussed during Trader's Breakfast by Santosh Meena, Head of Research, Swastika Investmart. The points below are a summary of the technical observations shared during the session and are provided solely for informational and educational purposes.
GE Vernova T&D India Ltd
GE Vernova T&D India Ltd was highlighted as one of today's stocks to watch, with the discussion noting that the power and data centre-related theme could remain in focus. During the session, it was observed that the stock has formed a base and is showing momentum. The discussion highlighted:
- ₹442 as the first level to watch.
- If the stock moves above ₹442, the next level discussed was ₹466.
- The previous day's low was mentioned as the stop-loss reference for this day-trading setup.
Hindalco Industries Ltd
Hindalco Industries Ltd was the second stock to watch today, discussed during the session. The technical observations shared included:
- The stock has formed a strong base above ₹200.
- A positive RSI setup was highlighted.
- ₹1,000 was discussed as the upside level to watch.
- ₹960 was mentioned as the support/stop-loss reference.
Nykaa
Nykaa was the third stock featured among today's stocks to watch for today. During the discussion, Santosh Meena noted that:
- The stock continues to display strong momentum following a phase of consolidation.
- The technical setup discussed points towards the ₹345–₹350 zone.
- ₹328 was identified as the stop-loss reference.
Stocks in News Today
Garden Reach Shipbuilders
Received a ₹1,032.07 crore Notification of Award from ONGC for the construction of four Platform Supply Vessels, to be executed over 48 months.
Tata Power
Completed the acquisition of a 100% stake in Ryapte Power Transmission for ₹10.87 crore. Tata Power Renewables also secured an 800 MW Inter-State Transmission System connectivity project with an investment of ₹5,750 crore.
Astra Microwave
Received an order worth ₹2,205.23 crore from HAL for the supply of 122 AAAUs and 121 Interface Frames for Uttam Radar. Execution is scheduled over five years.
PVR INOX
Opened a three-screen premium multiplex at Mall 11, Jabalpur, taking its network to 1,782 screens across 355 properties.
Q1 Results Today
F&O Companies
Frequently Asked Questions (FAQs)
Which are the stocks to watch today?
According to today's Trader's Breakfast, the stocks to watch today are GE Vernova T&D India Ltd, Hindalco Industries Ltd, and Nykaa, based on the technical observations discussed during the session.
What is today's Indian stock market outlook?
Today's Indian stock market outlook reflects positive global cues, a higher GIFT Nifty, positive FII cash market participation, and key technical levels for Nifty and Bank Nifty discussed in the market setup.
Which companies are announcing Q1 results today?
Companies including ABB, ITC, Maruti, Sun Pharma, GAIL, Dixon, Glenmark, Bajaj Finserv, National Aluminium, Shree Cement, Aether, SJVN, Concord Biotech, NH, GMDC and Voltamp are scheduled to announce Q1 results today.
Which stocks are in news today?
Today's stocks in news include Garden Reach Shipbuilders, Tata Power, Astra Microwave and PVR INOX based on the latest corporate developments.
Over to You
Stay connected with Trader's Breakfast for the latest Indian stock market news today, daily market updates, market movement, current stock market trends, and stocks to watch today, presented by Santosh Meena, Head of Research, Swastika Investmart.
For more stock market today India updates, share market news live, latest stock news, market outlook, and educational insights on the Indian stock share market, keep following Swastika Investmart. The Trader's Breakfast series helps you stay informed with timely market developments, technical observations, and key events shaping the trading session.

Nifty 50 Morning Market Summary – 30 Jul 2026
Key Takeaways
- Prev close reference: yesterday's close used for today's levels.
- Key level to watch: Nifty 50 pivot 24282.4 (R1 24377.7, R2 24438.25; S1 24221.85, S2 24126.55) and Bank Nifty pivot 57050.92 (R1 57333.23, R2 57518.97; S1 56865.18, S2 56582.87).
- Standout mover: INDOMIM from 485.0 to 741.75 (+52.94%).
- Market-wide Index Options PCR: Not available for this session.
Nifty 50 Support And Resistance Levels For 30 Jul 2026
Nifty Pivot Levels: Pivot 24282.4; R1 24377.7; R2 24438.25; S1 24221.85; S2 24126.55. Below or above pivot, the interpretation: pivot is central; R1 and R2 above pivot; S1 and S2 below pivot; The numbers are from the previous session's close, used as reference today.
Bank Nifty pivot levels: Pivot 57050.92; R1 57333.23; R2 57518.97; S1 56865.18; S2 56582.87. The same logic: resistance above pivot, support below pivot, with yesterday's close-based reference points.
For deeper stock-level insights, you can explore Swastika's Sarthi AI stock assistant.
Top 5 Gainers On 30 Jul 2026
| Ticker | Prev Price | Current Price | Change |
|---|---|---|---|
| INDOMIM | 485.0 | 741.75 | (+52.94%) |
| SMLMAH | 4566.0 | 5479.2 | (+20.00%) |
| GATECH | 0.49 | 0.58 | (+18.37%) |
| LCL | 425.0 | 494.6 | (+16.38%) |
| GATECHDVR | 0.44 | 0.49 | (+11.36%) |
Top 5 Losers On 30 Jul 2026
| Ticker | Prev Price | Current Price | Change |
|---|---|---|---|
| ADFFOODS | 301.8 | 262.35 | (-13.07%) |
| SERVOTECH | 92.25 | 81.83 | (-11.30%) |
| PCBL | 365.7 | 328.0 | (-10.31%) |
| THANGAMAYL | 6452.0 | 5807.0 | (-10.00%) |
| ORCHASP | 1.67 | 1.51 | (-9.58%) |
Market-Wide Index Options PCR
Market-wide Index Options PCR: Not available for this session.
Frequently Asked Questions
What are the Nifty 50 pivot levels for 30 Jul 2026?
Pivot: 24282.4; R1: 24377.7; R2: 24438.25; S1: 24221.85; S2: 24126.55.
What are the Nifty Bank pivot levels for 30 Jul 2026?
Pivot: 57050.92; R1: 57333.23; R2: 57518.97; S1: 56865.18; S2: 56582.87.
Who were the top gainers on 30 Jul 2026?
INDOMIM: 485.0 -> 741.75 (+52.94%); SMLMAH: 4566.0 -> 5479.2 (+20.00%); GATECH: 0.49 -> 0.58 (+18.37%); LCL: 425.0 -> 494.6 (+16.38%); GATECHDVR: 0.44 -> 0.49 (+11.36%).
Who were the top losers on 30 Jul 2026?
ADFFOODS: 301.8 -> 262.35 (-13.07%); SERVOTECH: 92.25 -> 81.83 (-11.30%); PCBL: 365.7 -> 328.0 (-10.31%); THANGAMAYL: 6452.0 -> 5807.0 (-10.00%); ORCHASP: 1.67 -> 1.51 (-9.58%).
Is there a market-wide PCR signal for 30 Jul 2026?
Market-wide Index Options PCR: Not available for this session.
Conclusion
Yesterday's close-based reference levels frame today's open. Watch Nifty 50 Pivot 24282.4 and Bank Nifty Pivot 57050.92; a break above R1 24377.7 or R2 24438.25 on Nifty could push higher, while a break below S1 24221.85 or S2 24126.55 could suggest a firmer downside. The standout mover INDOMIM and the listed losers provide context for risk and opportunities at the open. For deeper stock insights, use Swastika's Sarthi AI stock assistant.
Open with a clear move beyond 24377.7 or 24126.55 to set the bias.
Open your trading and demat account here
Reference :
1 : Nseindia
Big Budget


Popular Articles


.avif)
.avif)

.avif)


START YOUR INVESTMENT JOURNEY
Get personalized advice from our experts
- Dedicated RM Support
- Smooth and Fast Trading App
