
Live Nation Stock Price Signals From The World Cup Halftime Show


Key Takeaways
- The World Cup final halftime show marks a new era of mega-event marketing and its possible impact on entertainment equities.
- Over $50 million has been raised for education and football access, including $1 from every World Cup 2026 ticket sold.
- The show was produced by Global Citizen with Live Nation and Done + Dusted at MetLife Stadium.
- For retail investors, watching the live nation stock price can offer insights into how large events shape entertainment sector sentiment.
What happens when a stadium becomes a stage for a global fundraising mission and a test case for investor sentiment? The World Cup 2026 final's first-ever halftime show fused star power with social impact at MetLife Stadium, creating signal-rich data for retail investors watching the live nation stock price and other entertainment equities. The moment wasn’t just about performance; it was a real-world, live experiment in how mega-event narratives translate into brand equity and potential market reactions.
In a performance that drew Madonna, Shakira, BTS, Bieber, and Coldplay and featured Burna Boy, conductor Gustavo Dudamel, and the PS22 Chorus, the spectacle was both musical and philanthropic. It was directed by Hamish Hamilton and produced by Global Citizen in partnership with Live Nation and Done + Dusted. The event formed part of a four-year FIFA-Global Citizen partnership begun in September 2024 to expand access to education and football for children worldwide.
More than $50 million had already been raised through this effort, including $1 from every World Cup 2026 ticket sold. The halftime break, which ended 0-0, also drew criticism for the commercialization of the sport and concerns about FIFA's 15-minute halftime constraint. Yet the broader financial goal remains clear: the FIFA Global Citizen Education Fund backs the show, aiming to raise $100 million for education and sport globally. The running order included Madonna opening the show, followed by Ronaldo and Ronaldinho on stage; BTS then took the stage; Justin Bieber performed next; Shakira later joined Burna Boy to reprise their World Cup anthem Dai Dai, which they debuted at the tournament's opening ceremony; Coldplay closed the set.
From an investor’s lens, this event illustrates how branding, sponsorships, and philanthropic narratives can extend beyond the stadium into media, sponsorships, and consumer perception. The price action and sentiment around entertainment equities, including the live nation stock price, can reflect a blend of sponsorship demand, fan engagement, and the potential monetization of intangible assets like brand equity. While market data on stock movements is fluid and influenced by many factors, the event’s scale demonstrates the kind of catalysts investors monitor–brand partnerships, ticketing economics, and the ability to convert audience goodwill into durable value for the companies that orchestrate these experiences.
TLDR Note: The World Cup halftime show is a case study in event-driven marketing and investor signals. The organizers have already raised over $50 million, with $1 from every ticket sold, and the FIFA Global Citizen Education Fund aims for $100 million. The event was produced by Global Citizen in partnership with Live Nation and Done + Dusted at MetLife Stadium, featuring a star lineup and a carefully choreographed running order. For retail investors, watching the live nation stock price can offer insights into how large events shape entertainment sector sentiment.
Live Nation Stock Price Signals From The World Cup Halftime Show
The halftime show at the World Cup final was not just a spectacle; it was a live signal on how entertainment brands leverage cross-genre appeal and global philanthropy to create value beyond ticketing. The lineup alone–Madonna, Shakira, BTS, Bieber, Coldplay–plus Burna Boy and a classical touch from Gustavo Dudamel and the PS22 Chorus–demonstrates how a single event can stitch together multiple audiences, geographies, and revenue streams. For investors, this is a practical reminder that the long-term health of entertainment equities often hinges on two things: the ability to attract large-scale partnerships and the capacity to monetize social impact through sponsorships, media rights, and experiential offerings.
The event’s production, directed by Hamish Hamilton and produced by Global Citizen with Live Nation and Done + Dusted, underlines a familiar pattern: world-class events require collaboration across content creators, concert promoters, and philanthropic organizations. When Live Nation is part of the partnership, investors watch its stock price as a proxy for the health of the live events ecosystem–especially when a major event amplifies brand reach and drives incremental ticketing and sponsorship revenue. While the precise short-term moves of the live nation stock price will be influenced by many market factors, the signal from this show is clear: bigger, well-structured events with a clear social impact narrative can positively influence perceptions of the sponsors and promoters involved.
The World Cup project also serves as a practical reminder of the risk-reward balance in event-driven investing. The partnership between FIFA and Global Citizen began in September 2024 and is designed, in part, to widen access to education and sport for children worldwide. On the cost side, the event invites scrutiny on monetization pipelines–TV rights, streaming, sponsorships, and experiential offerings–that can feed back into the stock prices of participating firms. The halftime show’s ability to generate substantial philanthropic fundraising–over $50 million already, with $1 per ticket sold–illustrates how social impact initiatives can become tangible economic signals for investors who track the health of the entertainment ecosystem. The ongoing narrative around this partnership makes it a relevant data point for those tracking live nation stock price and related equities as part of a diversified research approach.
From a macro perspective, the event’s success echoes a broader market theme: investors reward scalable community-building initiatives that align brand value with social outcomes. The live nation stock price, like many other entertainment equities, may react not only to quarterly results but to the perceived durability of these partnerships and their potential to unlock new monetization routes–music, sports, and philanthropy wrapped into one compelling package. As retail investors compare Live Nation with peers and sector indices, the focus remains on how these experiences translate into durable demand, higher attendance, and deeper sponsorship pipelines over multiple years. In this evolving landscape, tools like Swastika's Sarthi AI stock assistant can help translate event-driven narratives into structured insights for stock moves and valuation scenarios.
How The Global Citizen Education Fund And Ticket Sales Drive Social Impact And Investor Sentiment
The FIFA Global Citizen Education Fund backs the show with a bold mission: to expand access to education and football for children worldwide. The fund’s stated goal is to raise $100 million, a target that reflects a sophisticated approach to combining social impact with sponsorship-driven revenue models. As of the latest public disclosures, more than $50 million had already been raised, and this momentum is an important signal for investors who watch philanthropic initiatives as catalysts for long-run brand equity and consumer engagement. The show’s funding model–funds raised through charitable channels linked to a marquee event–illustrates a blueprint for how entertainment platforms can generate positive externalities while cultivating loyal audiences, a dynamic that can influence investor sentiment toward the sponsors and promoters involved, including Live Nation.
The running order–Madonna opening, Ronaldo and Ronaldinho joining on stage, BTS following, Justin Bieber, Shakira with Burna Boy, and a closing by Coldplay–also underscores a strategic approach to lineup planning. This sequencing helps maximize cross-audience crossover and media coverage, which in turn helps sponsor visibility and ticket demand. The charity component is intrinsic to the event’s narrative; it isn’t merely an add-on but a core element that aligns the spectacle with social goals. For investors, this alignment can contribute to a longer-term premium in brand equity as audiences respond positively to corporate associations that support global education and sport accessibility. This is the kind of qualitative signal that investors incorporate alongside financial metrics when evaluating the health of entertainment equities and the live nation stock price trajectory over multi-year horizons.
In terms of market psychology, the philanthropic framing can dampen perceived risk around large-scale live events by signaling social value creation. When the narrative emphasizes education access and youth empowerment, it can soften concerns about the volatility of sponsorship revenue and ticket price sensitivity, as the philanthropic dimension creates a moral premium associated with the event. For retail investors, this dynamic can translate into a more resilient demand backdrop for Live Nation stock price, particularly if the company can articulate a clear link between event-driven partnerships and incremental revenue streams, streaming rights, and ancillary opportunities in hospitality and merchandise tied to high-profile events like a FIFA final halftime show.
However, it is important to acknowledge the other side of the coin. The show faced some criticism regarding the commercialization of football and potential tension with FIFA’s rules, including the 15-minute halftime policy. Such critiques matter because they shape public perception and influencer sentiment, which can in turn influence short- to medium-term stock movements in entertainment-related equities. Investors should monitor how the partnership and philanthropic framing evolves over time, as future iterations could either reinforce the value proposition or prompt policy-related adjustments that alter sponsorship economics. For careful investors, the key takeaway is to assess the sustainability of the social impact narrative and the ability of the organizers to scale these initiatives across future World Cups and other marquee events.
Metlife Stock Price: Insurance Sector Trends And Event-Driven Valuations
Beyond the arena, insurance sector equities like metlife stock price are influenced by macroeconomic conditions, interest rates, and consumer spending on discretionary services such as live entertainment. While the World Cup halftime show is a entertainment-centric event, its philanthropic framework and cross-border sponsorships contribute to a broader narrative about consumer engagement and brand affinity–factors that can indirectly support the risk profile and valuation models of insurance companies like MetLife. In times of elevated consumer confidence and strong discretionary spend, insurance-related stocks can benefit from a supportive macro backdrop and from investors seeking diversification across cyclicals. Observers tracking metlife stock price should consider not only the company’s fundamentals but also how the consumer, media, and entertainment ecosystems interact with the broader financial market environment. The cross-pollination between live events and consumer exposure can create nuanced shifts in risk sentiment that are worth watching for any diversified portfolio.
As the World Cup ecosystem evolves, market participants may also monitor the spillovers into other components of the entertainment value chain, including live music producers, venue operators, and ticketing platforms. While a single event does not determine long-run sector valuations, it can establish a storyline about scalable, repeatable models for combining live experiences with philanthropic impact–models that can translate into favorable sentiment for multiple adjacent equities, including those in the insurance and financial services sectors. In practice, this means investors should watch both the Live Nation-related channels and broader consumer-facing segments, such as metlife stock price, to form a holistic view of how social impact events influence cross-industry valuations over time.
Spain And Argentina Final: The World Cup Franchise And Investor Appetite For Mega-Events
The final was contested between Spain and Argentina, with the halftime score reading 0-0. This context is more than a sports result; it signals the enduring appeal of the World Cup franchise as a global media property with massive audience reach. For retail investors, the health of such a franchise matters because it correlates with demand for event-driven content, sponsorship, and the ability to monetize across platforms–from live venues to streaming, to branded consumer products. The World Cup ecosystem, anchored by partnerships among FIFA, Global Citizen, and Live Nation, signifies a durable platform for cross-media engagement. Investors may derive a broader signal from this: when a global sporting event is married to philanthropic aims and executed with world-class production, it can reinforce sustainable brand equity and create a favorable financing environment for associated entities that generate recurring revenue from multiple streams.
This dynamic also highlights the value of diversification in a retail investor’s toolkit. A portfolio that can weather the inherent volatility of sports and entertainment cycles benefits from exposure to companies that stand to gain from enduring relationships with fans, sponsors, and media distributors. In practical terms, this means watching Live Nation stock price in the context of media rights auctions, sponsorship contracts, and live event execution quality across multiple events and years. As such, the World Cup ecosystem offers a practical real-world case study for how strong brand partnerships and large-scale productions can influence investor sentiment and valuation trajectories in entertainment equities over time.
The Running Order And The Lineup: What The Halftime Show Teaches About Brand Partnerships
The running order–Madonna opening the set, Ronaldo and Ronaldinho joining, BTS following, Bieber taking the middle, Shakira with Burna Boy reprising Dai Dai, and Coldplay closing–illustrates a deliberate sequencing design to maximize reach and cross-audience appeal. For investors, the lesson is simple: the order and quality of partnerships matter for the overall market perception of the event and its sponsors. A carefully curated lineup can extend engagement across demographics, driving higher ticket conversion rates, longer media exposure, and stronger endorsement value for the brands involved. When a promoter can demonstrate that an event can attract a broad array of talent while maintaining a cohesive narrative around social impact, the market tends to reward the entities associated with the event–provided the execution remains top-tier and the sponsorship economics remain healthy. In practice, this means a company’s stock price and sentiment can be influenced by perceived execution quality, partner alignment, and the ability to maintain positive global visibility across audiences and media networks.
From the investor’s angle, the event’s scale is a reminder that strategic partnerships are a form of intangible asset with long shelf life. The protection and growth of these assets depend on consistent delivery in future iterations, transparent governance of philanthropic commitments, and a clear plan to translate audience goodwill into durable revenue streams. The World Cup halftime show, with its globally distributed audience, demonstrates how strong collaborations and social impact commitments can amplify brand value and investor confidence in the long run. For retail investors, the takeaway is to monitor not just quarterly earnings, but the durability of a company’s partnerships to support sustainable growth and valuation upside in entertainment equities over multi-year horizons.
Frequently Asked Questions
What was special about the FIFA World Cup 2026 final halftime show?
The show was the first-ever halftime performance in World Cup history, produced by Global Citizen in partnership with Live Nation and Done + Dusted at MetLife Stadium, featuring Madonna, Shakira, BTS, Bieber, and Coldplay, among others.
How much money was raised by the halftime show?
More than $50 million had already been raised, including $1 from every World Cup 2026 ticket sold.
Who produced the World Cup halftime show?
The event was produced by Global Citizen in partnership with Live Nation and Done + Dusted.
Where was the World Cup final halftime show held?
MetLife Stadium hosted the halftime show.
What is the purpose of the FIFA Global Citizen Education Fund?
The fund backs education and football access for children worldwide and aims to raise $100 million.
Which teams contested in the World Cup final?
Spain and Argentina contested the final, with the halftime score at 0-0.
Conclusion
What this World Cup halftime show ultimately demonstrates is how a single, well-executed event can become a macro signal for investors watching the entertainment and sponsorship ecosystem. The blend of star power, philanthropic intent, and strategic partnerships shows up in both qualitative perceptions and tangible fundraising outcomes. For retail investors, the pragmatic takeaway is to view such events as a test bed for the durability of brand partnerships and the ability to convert social impact into sustainable revenue streams. The next step is to integrate these signals into your analysis: track the live nation stock price and related equities, watch the evolution of the FIFA Global Citizen Education Fund’s fundraising trajectory, and evaluate how sponsorship pipelines evolve across future World Cups and similar mega-events. A practical mental model is to treat high-profile events as long-cycle catalysts for brand equity and sponsorship monetization, rather than as one-off spectacles.
Open your trading and demat account here
Reference :
1 : Ndtvprofit
Latest Articles
Live Nation Stock Price Signals From The World Cup Halftime Show


Key Takeaways
- The World Cup final halftime show marks a new era of mega-event marketing and its possible impact on entertainment equities.
- Over $50 million has been raised for education and football access, including $1 from every World Cup 2026 ticket sold.
- The show was produced by Global Citizen with Live Nation and Done + Dusted at MetLife Stadium.
- For retail investors, watching the live nation stock price can offer insights into how large events shape entertainment sector sentiment.
What happens when a stadium becomes a stage for a global fundraising mission and a test case for investor sentiment? The World Cup 2026 final's first-ever halftime show fused star power with social impact at MetLife Stadium, creating signal-rich data for retail investors watching the live nation stock price and other entertainment equities. The moment wasn’t just about performance; it was a real-world, live experiment in how mega-event narratives translate into brand equity and potential market reactions.
In a performance that drew Madonna, Shakira, BTS, Bieber, and Coldplay and featured Burna Boy, conductor Gustavo Dudamel, and the PS22 Chorus, the spectacle was both musical and philanthropic. It was directed by Hamish Hamilton and produced by Global Citizen in partnership with Live Nation and Done + Dusted. The event formed part of a four-year FIFA-Global Citizen partnership begun in September 2024 to expand access to education and football for children worldwide.
More than $50 million had already been raised through this effort, including $1 from every World Cup 2026 ticket sold. The halftime break, which ended 0-0, also drew criticism for the commercialization of the sport and concerns about FIFA's 15-minute halftime constraint. Yet the broader financial goal remains clear: the FIFA Global Citizen Education Fund backs the show, aiming to raise $100 million for education and sport globally. The running order included Madonna opening the show, followed by Ronaldo and Ronaldinho on stage; BTS then took the stage; Justin Bieber performed next; Shakira later joined Burna Boy to reprise their World Cup anthem Dai Dai, which they debuted at the tournament's opening ceremony; Coldplay closed the set.
From an investor’s lens, this event illustrates how branding, sponsorships, and philanthropic narratives can extend beyond the stadium into media, sponsorships, and consumer perception. The price action and sentiment around entertainment equities, including the live nation stock price, can reflect a blend of sponsorship demand, fan engagement, and the potential monetization of intangible assets like brand equity. While market data on stock movements is fluid and influenced by many factors, the event’s scale demonstrates the kind of catalysts investors monitor–brand partnerships, ticketing economics, and the ability to convert audience goodwill into durable value for the companies that orchestrate these experiences.
TLDR Note: The World Cup halftime show is a case study in event-driven marketing and investor signals. The organizers have already raised over $50 million, with $1 from every ticket sold, and the FIFA Global Citizen Education Fund aims for $100 million. The event was produced by Global Citizen in partnership with Live Nation and Done + Dusted at MetLife Stadium, featuring a star lineup and a carefully choreographed running order. For retail investors, watching the live nation stock price can offer insights into how large events shape entertainment sector sentiment.
Live Nation Stock Price Signals From The World Cup Halftime Show
The halftime show at the World Cup final was not just a spectacle; it was a live signal on how entertainment brands leverage cross-genre appeal and global philanthropy to create value beyond ticketing. The lineup alone–Madonna, Shakira, BTS, Bieber, Coldplay–plus Burna Boy and a classical touch from Gustavo Dudamel and the PS22 Chorus–demonstrates how a single event can stitch together multiple audiences, geographies, and revenue streams. For investors, this is a practical reminder that the long-term health of entertainment equities often hinges on two things: the ability to attract large-scale partnerships and the capacity to monetize social impact through sponsorships, media rights, and experiential offerings.
The event’s production, directed by Hamish Hamilton and produced by Global Citizen with Live Nation and Done + Dusted, underlines a familiar pattern: world-class events require collaboration across content creators, concert promoters, and philanthropic organizations. When Live Nation is part of the partnership, investors watch its stock price as a proxy for the health of the live events ecosystem–especially when a major event amplifies brand reach and drives incremental ticketing and sponsorship revenue. While the precise short-term moves of the live nation stock price will be influenced by many market factors, the signal from this show is clear: bigger, well-structured events with a clear social impact narrative can positively influence perceptions of the sponsors and promoters involved.
The World Cup project also serves as a practical reminder of the risk-reward balance in event-driven investing. The partnership between FIFA and Global Citizen began in September 2024 and is designed, in part, to widen access to education and sport for children worldwide. On the cost side, the event invites scrutiny on monetization pipelines–TV rights, streaming, sponsorships, and experiential offerings–that can feed back into the stock prices of participating firms. The halftime show’s ability to generate substantial philanthropic fundraising–over $50 million already, with $1 per ticket sold–illustrates how social impact initiatives can become tangible economic signals for investors who track the health of the entertainment ecosystem. The ongoing narrative around this partnership makes it a relevant data point for those tracking live nation stock price and related equities as part of a diversified research approach.
From a macro perspective, the event’s success echoes a broader market theme: investors reward scalable community-building initiatives that align brand value with social outcomes. The live nation stock price, like many other entertainment equities, may react not only to quarterly results but to the perceived durability of these partnerships and their potential to unlock new monetization routes–music, sports, and philanthropy wrapped into one compelling package. As retail investors compare Live Nation with peers and sector indices, the focus remains on how these experiences translate into durable demand, higher attendance, and deeper sponsorship pipelines over multiple years. In this evolving landscape, tools like Swastika's Sarthi AI stock assistant can help translate event-driven narratives into structured insights for stock moves and valuation scenarios.
How The Global Citizen Education Fund And Ticket Sales Drive Social Impact And Investor Sentiment
The FIFA Global Citizen Education Fund backs the show with a bold mission: to expand access to education and football for children worldwide. The fund’s stated goal is to raise $100 million, a target that reflects a sophisticated approach to combining social impact with sponsorship-driven revenue models. As of the latest public disclosures, more than $50 million had already been raised, and this momentum is an important signal for investors who watch philanthropic initiatives as catalysts for long-run brand equity and consumer engagement. The show’s funding model–funds raised through charitable channels linked to a marquee event–illustrates a blueprint for how entertainment platforms can generate positive externalities while cultivating loyal audiences, a dynamic that can influence investor sentiment toward the sponsors and promoters involved, including Live Nation.
The running order–Madonna opening, Ronaldo and Ronaldinho joining on stage, BTS following, Justin Bieber, Shakira with Burna Boy, and a closing by Coldplay–also underscores a strategic approach to lineup planning. This sequencing helps maximize cross-audience crossover and media coverage, which in turn helps sponsor visibility and ticket demand. The charity component is intrinsic to the event’s narrative; it isn’t merely an add-on but a core element that aligns the spectacle with social goals. For investors, this alignment can contribute to a longer-term premium in brand equity as audiences respond positively to corporate associations that support global education and sport accessibility. This is the kind of qualitative signal that investors incorporate alongside financial metrics when evaluating the health of entertainment equities and the live nation stock price trajectory over multi-year horizons.
In terms of market psychology, the philanthropic framing can dampen perceived risk around large-scale live events by signaling social value creation. When the narrative emphasizes education access and youth empowerment, it can soften concerns about the volatility of sponsorship revenue and ticket price sensitivity, as the philanthropic dimension creates a moral premium associated with the event. For retail investors, this dynamic can translate into a more resilient demand backdrop for Live Nation stock price, particularly if the company can articulate a clear link between event-driven partnerships and incremental revenue streams, streaming rights, and ancillary opportunities in hospitality and merchandise tied to high-profile events like a FIFA final halftime show.
However, it is important to acknowledge the other side of the coin. The show faced some criticism regarding the commercialization of football and potential tension with FIFA’s rules, including the 15-minute halftime policy. Such critiques matter because they shape public perception and influencer sentiment, which can in turn influence short- to medium-term stock movements in entertainment-related equities. Investors should monitor how the partnership and philanthropic framing evolves over time, as future iterations could either reinforce the value proposition or prompt policy-related adjustments that alter sponsorship economics. For careful investors, the key takeaway is to assess the sustainability of the social impact narrative and the ability of the organizers to scale these initiatives across future World Cups and other marquee events.
Metlife Stock Price: Insurance Sector Trends And Event-Driven Valuations
Beyond the arena, insurance sector equities like metlife stock price are influenced by macroeconomic conditions, interest rates, and consumer spending on discretionary services such as live entertainment. While the World Cup halftime show is a entertainment-centric event, its philanthropic framework and cross-border sponsorships contribute to a broader narrative about consumer engagement and brand affinity–factors that can indirectly support the risk profile and valuation models of insurance companies like MetLife. In times of elevated consumer confidence and strong discretionary spend, insurance-related stocks can benefit from a supportive macro backdrop and from investors seeking diversification across cyclicals. Observers tracking metlife stock price should consider not only the company’s fundamentals but also how the consumer, media, and entertainment ecosystems interact with the broader financial market environment. The cross-pollination between live events and consumer exposure can create nuanced shifts in risk sentiment that are worth watching for any diversified portfolio.
As the World Cup ecosystem evolves, market participants may also monitor the spillovers into other components of the entertainment value chain, including live music producers, venue operators, and ticketing platforms. While a single event does not determine long-run sector valuations, it can establish a storyline about scalable, repeatable models for combining live experiences with philanthropic impact–models that can translate into favorable sentiment for multiple adjacent equities, including those in the insurance and financial services sectors. In practice, this means investors should watch both the Live Nation-related channels and broader consumer-facing segments, such as metlife stock price, to form a holistic view of how social impact events influence cross-industry valuations over time.
Spain And Argentina Final: The World Cup Franchise And Investor Appetite For Mega-Events
The final was contested between Spain and Argentina, with the halftime score reading 0-0. This context is more than a sports result; it signals the enduring appeal of the World Cup franchise as a global media property with massive audience reach. For retail investors, the health of such a franchise matters because it correlates with demand for event-driven content, sponsorship, and the ability to monetize across platforms–from live venues to streaming, to branded consumer products. The World Cup ecosystem, anchored by partnerships among FIFA, Global Citizen, and Live Nation, signifies a durable platform for cross-media engagement. Investors may derive a broader signal from this: when a global sporting event is married to philanthropic aims and executed with world-class production, it can reinforce sustainable brand equity and create a favorable financing environment for associated entities that generate recurring revenue from multiple streams.
This dynamic also highlights the value of diversification in a retail investor’s toolkit. A portfolio that can weather the inherent volatility of sports and entertainment cycles benefits from exposure to companies that stand to gain from enduring relationships with fans, sponsors, and media distributors. In practical terms, this means watching Live Nation stock price in the context of media rights auctions, sponsorship contracts, and live event execution quality across multiple events and years. As such, the World Cup ecosystem offers a practical real-world case study for how strong brand partnerships and large-scale productions can influence investor sentiment and valuation trajectories in entertainment equities over time.
The Running Order And The Lineup: What The Halftime Show Teaches About Brand Partnerships
The running order–Madonna opening the set, Ronaldo and Ronaldinho joining, BTS following, Bieber taking the middle, Shakira with Burna Boy reprising Dai Dai, and Coldplay closing–illustrates a deliberate sequencing design to maximize reach and cross-audience appeal. For investors, the lesson is simple: the order and quality of partnerships matter for the overall market perception of the event and its sponsors. A carefully curated lineup can extend engagement across demographics, driving higher ticket conversion rates, longer media exposure, and stronger endorsement value for the brands involved. When a promoter can demonstrate that an event can attract a broad array of talent while maintaining a cohesive narrative around social impact, the market tends to reward the entities associated with the event–provided the execution remains top-tier and the sponsorship economics remain healthy. In practice, this means a company’s stock price and sentiment can be influenced by perceived execution quality, partner alignment, and the ability to maintain positive global visibility across audiences and media networks.
From the investor’s angle, the event’s scale is a reminder that strategic partnerships are a form of intangible asset with long shelf life. The protection and growth of these assets depend on consistent delivery in future iterations, transparent governance of philanthropic commitments, and a clear plan to translate audience goodwill into durable revenue streams. The World Cup halftime show, with its globally distributed audience, demonstrates how strong collaborations and social impact commitments can amplify brand value and investor confidence in the long run. For retail investors, the takeaway is to monitor not just quarterly earnings, but the durability of a company’s partnerships to support sustainable growth and valuation upside in entertainment equities over multi-year horizons.
Frequently Asked Questions
What was special about the FIFA World Cup 2026 final halftime show?
The show was the first-ever halftime performance in World Cup history, produced by Global Citizen in partnership with Live Nation and Done + Dusted at MetLife Stadium, featuring Madonna, Shakira, BTS, Bieber, and Coldplay, among others.
How much money was raised by the halftime show?
More than $50 million had already been raised, including $1 from every World Cup 2026 ticket sold.
Who produced the World Cup halftime show?
The event was produced by Global Citizen in partnership with Live Nation and Done + Dusted.
Where was the World Cup final halftime show held?
MetLife Stadium hosted the halftime show.
What is the purpose of the FIFA Global Citizen Education Fund?
The fund backs education and football access for children worldwide and aims to raise $100 million.
Which teams contested in the World Cup final?
Spain and Argentina contested the final, with the halftime score at 0-0.
Conclusion
What this World Cup halftime show ultimately demonstrates is how a single, well-executed event can become a macro signal for investors watching the entertainment and sponsorship ecosystem. The blend of star power, philanthropic intent, and strategic partnerships shows up in both qualitative perceptions and tangible fundraising outcomes. For retail investors, the pragmatic takeaway is to view such events as a test bed for the durability of brand partnerships and the ability to convert social impact into sustainable revenue streams. The next step is to integrate these signals into your analysis: track the live nation stock price and related equities, watch the evolution of the FIFA Global Citizen Education Fund’s fundraising trajectory, and evaluate how sponsorship pipelines evolve across future World Cups and similar mega-events. A practical mental model is to treat high-profile events as long-cycle catalysts for brand equity and sponsorship monetization, rather than as one-off spectacles.
Open your trading and demat account here
Reference :
1 : Ndtvprofit
Bharti Airtel Share Price And Weekly Corporate Actions: A Retail Investor's Guide
Key Takeaways
- Ex-dividend dates and a stock split cycle shape bharti airtel share price dynamics this week.
- Bharti Airtel final dividend of Rs 24 per share is due on July 24, influencing price behavior around the ex-date.
- Stock splits and bonus actions across Simplex Castings, Pondy Oxides & Chemicals, Kalind change share counts and liquidity.
- Use Swastika's Sarthi AI stock assistant for data-driven analysis of corporate actions and price moves.
What if a single week could rewrite the numbers you watch before you place a trade? This week delivers a cascade of ex-dividends, stock splits, and a spin-off that traders must track to understand the bharti airtel share price trajectory and other stock moves. Retail investors across India should pay attention to these corporate actions as they can affect liquidity, pricing, and potential yield opportunities.
Here's a structured look at the key actions scheduled, their dates, and what they could mean for your portfolio. We'll also translate these events into practical moves you can apply in your own trading or long-term investing, including a quick look at pidilite industries stock price movements this week and a reminder to consider bharti airtel stock price dynamics as ex-dividend dates approach.
Bharti Airtel Share Price And The Week's Corporate Actions: What Investors Should Watch
On Friday, July 24, Bharti Airtel Ltd will go ex-dividend for a final dividend of Rs 24 per share. Ex-dividends are a fundamental factor that often tests the bharti airtel share price as the market adjusts for the payout. For retail investors, this is a lever to consider if you plan to hold through the ex-date or buy before to capture the dividend. This week's calendar places Bharti Airtel among several other names triggering ex-dividends and other corporate actions, including Angel One, Hero MotoCorp, Zydus Lifesciences, and Pidilite Industries.
Beyond Bharti Airtel, the calendar shows a mix of final and interim dividends scheduled across multiple companies, with a few unusual actions that could influence the overall stock sentiment. For instance, on Monday, July 20, Graphite India Ltd, Happy Forgings Ltd, K.P.R. Mill Ltd, NESCO Ltd, Quest Capital Markets Ltd, and SPR Auto Technologies Ltd go ex-dividend for final dividends ranging from Rs 2.5 to Rs 7 and above. These payments often correspond with small price adjustments in the same week, which can create short-term trading opportunities for swing traders and longer-term investors observing the bharti airtel share price in context of the broader market moves.
Ex-Dividend And Interim Dividends: A Calendar Of The Week
On Tuesday, July 21, Angel One Ltd becomes eligible for an interim dividend of Rs 1 per share, while Cholamandalam Investment and Finance Company Ltd offers a final dividend of Rs 0.7 per share. Indo Borax & Chemicals Ltd shows a dual action: a final dividend of Rs 10 per share and a special dividend of Rs 30 per share. Ksolves India Ltd declares an interim dividend of Rs 4 per share, Punjab & Sind Bank a final Rs 0.39 per share, and Rainbow Children's Medicare Ltd a dividend of Rs 3.5 per share. These ex-dividend actions help calibrate the bharti airtel share price as investors reassess valuations across sectors.
On Wednesday, July 22, Aditya Birla Sun Life AMC Ltd declares a final dividend of Rs 25.5 per share, Hawkins Cookers Ltd a hefty Rs 140 per share, HEG Ltd a final Rs 3.4 per share, Taparia Tools Ltd Rs 35 per share, and Thangamayil Jewellery Ltd Rs 18 per share. Each of these actions can affect sector-specific sentiment and the overall market, influencing how the bharti airtel share price trades in the short term.
On Thursday, July 23, D. B. Corp Ltd goes ex-dividend with an interim Rs 5 per share; Esab India Ltd pays a final Rs 25 per share; ICRA Ltd pays a final Rs 70 per share and also a special Rs 35 per share; Oberoi Realty Ltd declares an interim Rs 2 per share; Pidilite Industries Ltd goes ex-dividend with a final Rs 11.5 per share; Precision Camshafts Ltd Rs 1 per share; Sudeep Pharma Ltd Rs 1.5 per share. With so many payouts, price adjustments across names might ripple into the broader market, including how bharti airtel stock price responds to the ex-date dynamics.
On Friday, July 24, Abbott India Ltd goes ex-dividend with a final Rs 525 per share and a special Rs 131 per share; Bharti Airtel Ltd ex-dividend final Rs 24 per share; Concord Biotech Ltd Rs 7.55; Crompton Greaves Consumer Electricals Ltd Rs 3; Data Patterns (India) Ltd Rs 10; Divi's Laboratories Ltd Rs 30; Hero MotoCorp Ltd Rs 75; Info Edge (India) Ltd Rs 3.6; Karur Vysya Bank Ltd Rs 2.6; Neuland Laboratories Ltd Rs 34; Radico Khaitan Ltd Rs 9; Voltamp Transformers Ltd Rs 100; Zydus Lifesciences Ltd Rs 1. These payouts reinforce why price action around ex-div dates matters for investors monitoring bharti airtel stock price and pidilite industries stock price alike.
Stock Splits, Bonus Issues, And Spin-Off: The Mechanical Changes In July 2026
In addition to dividends, the week brings stock splits for three companies, which increase the number of shares outstanding and slightly adjust per-share pricing without changing the overall market value. Simplex Castings Ltd will turn ex-split on Monday, July 20, with one equity share of Rs 10 face value converting into five equity shares of Rs 2 each. Pondy Oxides & Chemicals Ltd will turn ex-split on Tuesday, July 21, with one equity share of Rs 5 face value becoming five shares of Rs 2 each. Kalind Ltd will turn ex-split on Friday, July 24, with one equity share of Rs 10 face value into five equity shares of Rs 2 each. An additional consequence is a bonus issue: Kalind Ltd will ex-bonus on Friday, July 24 for a bonus issue in the ratio of 1:2. These are structural adjustments to the share count that can affect liquidity and how investors perceive the bharti airtel share price in the near term when seen in a wider market context.
Separately, a spin-off is scheduled for Triveni Engineering & Industries Ltd on Wednesday, July 22 following the demerger of its business undertaking under the approved scheme of arrangement. Spin-offs can lead to dislocations and new investment theses as the market re-prices the parent and the spun-off entity, so investors should track price action across related names to gauge relative performance against the bharti airtel share price path.
Pidilite Industries Stock Price And Ex-Dividends This Week
Pidilite Industries Ltd is among the names with ex-dividend action this week. Specifically, on Thursday, July 23, Pidilite Industries Ltd goes ex-dividend with a final Rs 11.5 per share. On Friday, July 24, it also features in the broader ex-date wave with final Rs 1 per share. The status around pidilite industries stock price around these dates can reflect payout expectations and how the stock trades around ex-dividend events. Investors monitoring pidilite industries stock price should correlate this with other industrials movements and evaluate whether any price drift aligns with dividend timing.
For overall market context, Bharti Airtel's ex-dividend event on Friday remains a central reference for the week’s action and is typically a reference point for price behavior around other dividend announcements. The interaction between dividend timing and investor sentiment could be a factor in short-term bharti airtel stock price movements as well as the broader market cycle.
Practical Strategies For Retail Investors This Week
With such a packed calendar, a practical approach is to map your trades by sequence: identify ex-dividend dates that directly affect holdings, decide whether you want to capture the dividend (and risk the post-ex-date price drift), and keep an eye on the stock splits and spin-off actions that may alter underlying liquidity. If you hold Bharti Airtel stock through the ex-date, the Rs 24 final dividend will be paid out; if you are considering buying before ex-date to capture the dividend, you should factor in the expected price adjustment and the anticipated yield. Use the ex-dividend data to calibrate your bharti airtel share price expectations as the week unfolds, and consider how pidilite industries stock price may move in parallel or as a counterpoint within your portfolio.
For a more data-driven approach, consider using Swastika's Sarthi AI stock assistant to simulate different scenarios across the week’s corporate actions and to forecast potential price ranges for Bharti Airtel and other names in your watchlist. Swastika's Sarthi AI stock assistant can help you quickly analyze the interplay between ex-dividends, splits, and spin-offs with historical context and current market conditions.
Measuring The Week’s Movements: What The Numbers Say
In a week with multiple payout events, a practical investor approach is to monitor price action before and after ex-dividend dates. The Bharti Airtel share price, for example, might experience a temporary adjustment around July 24 as the company pays out Rs 24 per share, followed by potential re-rating as investors digest the cash flow and any implied yield. At the same time, other ex-dividend events–like the Rs 140 payout at Hawkins Cookers or the Rs 525 final dividend at Abbott India–can widen dispersion in the market. By watching the relative moves across these names, you get a sense of how the market prices cash returns and how that pricing interacts with long-term value creation for Bharti Airtel and pidilite industries stock price in the near term.
For a concrete calendar reference, capture the entire list of ex-dividends, stock splits, and spin-offs in the table above and compare how the bharti airtel share price moves relative to other stocks. The broader lesson for retail investors is to think in terms of yield, price drift, and liquidity–rather than chasing single-name moves–when a week features this many corporate actions.
Related Reads
- Dividend Stocks To Watch: Bharti Airtel Share Price, Hero MotoCorp, Angel One And 88 Others
- Bharti Airtel Share Price Insights: Record Dates, Dividends, Splits, And Market Signals
Frequently Asked Questions
What is Bharti Airtel ex-dividend date and dividend amount this week?
Bharti Airtel Ltd will go ex-dividend on Friday, July 24 for a final dividend of Rs 24 per share.
Which stocks are having stock splits during this week?
Simplex Castings Ltd ex-split: 1 share of Rs 10 into five shares of Rs 2; Pondy Oxides & Chemicals Ltd ex-split: Rs 5 face value into five shares of Rs 2; Kalind Ltd ex-split: Rs 10 face value into five shares of Rs 2.
What is Kalind's Bonus Issue and when does it occur?
Kalind Ltd ex-bonus on Friday, July 24 for a bonus issue in the ratio of 1:2.
What is the spin-off action for Triveni Engineering & Industries?
Triveni Engineering & Industries Ltd ex-spin-off on Wednesday, July 22 following the demerger of its business undertaking under the approved scheme of arrangement.
Where can I get more details about these corporate actions and price data?
Use Swastika's Sarthi AI stock assistant for institutional-grade research on any stock or index to retail investors.
Conclusion
This week's corporate actions create a distinct price and liquidity puzzle around the bharti airtel share price and several other names. The most impactful items–Bharti Airtel’s Rs 24 final dividend on July 24, the multiple ex-dividends across a broad set of names, and the stock splits and spin-off–shape near-term price dynamics and potential yields for patient investors. Use these signals to structure a disciplined plan: map ex-dividend dates to your existing holdings, consider how dividend timing interacts with price drift, and think in terms of cash flow and risk-adjusted returns rather than one-off price moves.
The next step is to translate this understanding into action: build a simple decision framework that weighs dividend capture against post-ex-date price behavior, review pidilite industries stock price alongside bharti airtel stock moves, and explore the Sarthi AI stock assistant for a data-driven scenario model that aligns with your risk tolerance and time horizon.
Open your trading and demat account here
Reference :
1 : Ndtvprofit
Nokia Stock Price Signals In The India-Spain UPI-Bizum Interoperability Era
Key Takeaways
- India and Spain advanced technical talks on UPI-Bizum interoperability, signaling a cross-border payments shift.
- The Commerce Ministry of India outlined a broad cooperation agenda spanning investments, mobility and Latin America.
- Opportunities span autos, pharma, chemicals, textiles, renewable energy, tourism and infrastructure as cross-border linkages deepen.
- Key potential accords include an Investment Protection Agreement, Geographical Indications, CBAM cooperation, regulatory simplification and agri market access.
Two economies, two digital rails, and one cross-border ambition: interoperability between India's UPI and Spain's Bizum has moved from talk to technical groundwork during Commerce Minister Piyush Goyal's Spain visit on July 19, 2026. For retail investors, nokia stock price is a useful barometer of how policy shifts translate into market moves in global tech and manufacturing equities. The Commerce Ministry of India published the briefing outlining a roadmap to ease investments, improve mobility of professionals, and foster joint investments in Latin America, while laying out a framework for cross-border payments interoperability that could widen digital commerce across Europe and Asia. The read time for the briefing is approximately 2 mins, underscoring the speed with which policy signals can translate into market thinking.
The central objective is to advance technical discussions on interoperability between UPI and Bizum so that cross-border payments between India and Spain become faster, cheaper, and more seamless. The talks sit within a broader policy ecosystem that includes plans to launch an India-EU dialogue on skills, education and talent mobility, with the Brussels venue cited as a related anchor for broader European cooperation. The moment ties a digital payments roadmap to a larger economic strategy–one that envisions re-architecting supply chains, investment flows, and professional mobility in a rapidly changing global market. The read time for the briefing remains 2 mins.
During these discussions, executives from KONE and Nokia reportedly met with Minister Goyal, signaling the intersection of policy momentum with real-world manufacturing and technology outputs. The emphasis on cross-border cooperation spurs a set of opportunities across sectors such as automobiles, pharmaceuticals, chemicals, textiles, renewable energy, tourism, and infrastructure. The overarching goal is to expand manufacturing, research and development, exports, and digital infrastructure investments in India, while sharpening the interface between Indian and European markets. The event also signals a broader strategic alignment that could influence how multinational suppliers operate within Indian value chains and European distribution channels.
India-Spain UPI-Bizum Interoperability: What It Means For Retail Investors
The primary outcome of the talks is to advance technical discussions on interoperability between UPI and Bizum. For retail investors, that translates into potential improvements in cross-border settlement times, reduced friction for merchants operating in both markets, and the creation of a more integrated payments ecosystem that could support growth in digital commerce and fintech services. In practical terms, interoperable rails could help Indian exporters and Spanish merchants pricing and settle cross-border transactions more efficiently, indirectly supporting earnings visibility for firms connected to digital payments, fintech, and logistics. The policy process, anchored in the Commerce Ministry of India, also signals that the government is prioritizing cross-border trade facilitation, investment protection, and regulatory alignment as a means to energize both macro growth and micro investments in Indian markets. The broader context includes the India-EU dialogue on skills and talent mobility, which could influence labor costs and project timelines for tech and manufacturing initiatives tied to cross-border activity.
For investors, the practical implication lies in the potential expansion of digital commerce corridors and the associated upside for logistics, e-commerce, and fintech players. The discussion also reflects a broader trend toward regulatory cooperation that could shorten the time-to-market for cross-border services and reduce compliance complexity for firms operating in multiple jurisdictions. As always, the exact policy mechanics will unfold over time, but the direction is clear: a more connected, interoperable payments ecosystem that could facilitate faster, cheaper cross-border trade and investment flows.
Interoperability Roadmap: Investment Protection, Geographical Indications And CBAM
In addition to payments interoperability, the discussions cover concrete policy milestones. An Investment Protection Agreement would help safeguard investments across borders; a Geographical Indications Agreement would protect brand names tied to specific regions, enhancing export potential. There is also a cooperative pathway on the Carbon Border Adjustment Mechanism to align environmental rules in trade; regulatory simplification is another target to streamline approvals and reduce the compliance burden. The talks include market access for agricultural products and the potential for a duty derogation on Basmati rice and steel scrap to support Indian manufacturing supply chains. Taken together, these measures would help create a more predictable environment for investors and exporters alike. This framework is intended to enable smoother cross-border operations, improved brand protection, and better alignment of climate-related trade rules with business realities.
Beyond the direct policy elements, the conversations suggest a broader strategic push toward deeper economic integration with Spain and within the European Union. A stable, rules-based environment can reduce transactional risk for Indian manufacturers exporting to EU markets and for Spanish firms seeking to source from India. The potential regulatory simplifications, if implemented, could shave operating costs and reduce time-to-market for multiple product lines–from automotive components to pharmaceuticals and textiles–thereby enhancing the competitive position of Indian and Spanish corporates alike.
Sectoral Opportunities From Cross-Border Collaboration
From the policymakers' perspective, the cross-border tie-up opens opportunities across automobiles, pharmaceuticals, chemicals, textiles, renewable energy, tourism, and infrastructure. India offers strengths in manufacturing and services, while Spain brings manufacturing prowess in several of these spaces and access to European markets. A collaborative framework could accelerate manufacturing scale, boost R&D, support exports, and strengthen digital infrastructure investments in India. For a retail investor, the interplay between policy momentum and sector-specific fundamentals could yield improved growth trajectories for listed companies tied to these sectors, including suppliers, manufacturers, and logistics players who stand to gain from more integrated cross-border trade. Companies involved in auto parts, chemicals processing, textile machinery, solar and wind services, and logistics infrastructure could see acceleration if cross-border trade flows intensify and regulatory friction declines. Investors should watch sectoral earnings, order backlogs, and capex cycles that align with the policy trajectory described here.
In practice, cross-border collaboration could also nurture research collaborations and joint ventures, expanding both product breadth and geographic reach. Regions with established industrial ecosystems–such as Spain's engineering base and India's growing manufacturing scale–could see accelerated product development, faster regulatory approvals for new products, and an uptick in engineering services demand. The policy backdrop can support such outcomes by reducing non-tariff barriers and by streamlining clearance processes, making it easier for Indian and European firms to partner on technology-driven growth initiatives that span supply chains, R&D, and market access.
Policy Initiatives To Boost Mobility And Talent Across Markets
Beyond payments interoperability, the policy agenda also aims to improve mobility of professionals and the exchange of skills and education. The plan to launch an India-EU dialogue on skills and talent mobility aligns with the broader goal of building a more agile, globally connected labor market. Brussels was cited as a related venue for broader discussions, reflecting a multi-party approach to harmonizing standards, education, and talent pipelines that feed into industrial production and export capacity. For retail investors who track earnings and valuations of companies in technology, manufacturing, and logistics, the mobility initiatives can influence workforce productivity, project execution timelines, and supply chain resilience. When workers can move more easily and training standards become harmonized, companies tend to realize faster product cycles and better access to global talent pools, which in turn can improve margins and long-term growth trajectories.
As these mobility reforms progress, investors should assess the impact on labor-intensive segments and on companies with global supply chains or heavy R&D investments. A more mobile talent pool can support higher-value-added manufacturing and services, which, in turn, could influence stock prices in sectors like technology hardware, industrials, and logistics.
Nokia Stock Price And Global Tech Signals
The nokia stock price and the nokia adr share price can provide a lens into how investors are pricing telecom equipment, networks, and related hardware in light of cross-border policy shifts. The kone elevator stock price provides a parallel lens on infrastructure and urban modernization, which often tracks growth in construction and maintenance activity. While price levels will ebb and flow with market sentiment, the directional dynamics – policy clarity, cross-border trade expansion, and sector-specific earnings – can guide retail investors in calibrating their portfolios toward resilience and growth in a more interconnected world. For context, global tech cycles, 5G deployment, and regional digitization efforts will influence these price paths, so investors should consider how policy momentum interacts with earnings quality and balance-sheet strength across the sector.
As you map these themes to your investment approach, consider using Swastika's Sarthi AI stock assistant to translate macro policy signals into actionable ideas. Swastika's Sarthi AI stock assistant can help you synthesize these cross-border developments with stock-level data and risk insights.
Frequently Asked Questions
What is the main outcome of the India-Spain talks on UPI-Bizum interoperability?
The primary outcome is the agreement to advance technical discussions on interoperability between India's UPI and Spain's Bizum, with the Commerce Ministry of India leading the process during the visit of Commerce and Industry Minister Piyush Goyal.
Which ministry is coordinating the talks and who is the key official involved?
The Commerce Ministry of India is coordinating the talks, led by Commerce and Industry Minister Piyush Goyal during his Spain visit.
What sectoral opportunities are identified as a result of deeper cross-border ties?
Opportunities span automobiles, pharmaceuticals, chemicals, textiles, renewable energy, tourism, and infrastructure as cross-border linkages deepen.
What key agreements and regulatory areas were discussed to support interop and trade?
The discussions include an Investment Protection Agreement, a Geographical Indications Agreement, cooperation on the Carbon Border Adjustment Mechanism (CBAM), regulatory simplification, market access for agricultural products, and potential duty derogation on Basmati rice and steel scrap.
Were there any notable corporate engagements mentioned in relation to the talks?
Executives from KONE and Nokia met with Commerce Minister Piyush Goyal, signaling interest from major manufacturers in cross-border manufacturing, R&D, exports, and digital infrastructure investments in India.
Conclusion
The India's move toward UPI-Bizum interoperability with Spain signals more than a new digital payments channel; it marks a strategic alignment of policy, trade, and technology across major markets. For the retail investor, the core takeaway is to recognize how cross-border payment interoperability can unlock smoother cross-border trade, spur sectoral investment, and shape corporate earnings in autos, pharma, chemicals, textiles, renewables, tourism, and infrastructure. The ongoing India-EU and broader Europe-Asia collaboration suggests that a more connected, rules-based, innovation-driven growth cycle is taking shape, with policy clarity and regulatory simplification potentially reducing friction for Indian exporters and European partners. A practical next step is to map these macro developments to your stock watchlist, focusing on tech hardware, manufacturing, and logistics names that could benefit from a more integrated global payments regime.
Open your trading and demat account here
Reference :
1 : Ndtvprofit
Nagaland Landslide: A Retail Investor’s Guide To Risk, Relief, And Recovery
Key Takeaways
- A nagaland landslide in Mon district triggers immediate rescue operations and regional disruption.
- Authorities initially report four dead, with four more feared trapped.
- Later updates indicate eight feared dead and four bodies recovered.
- Investors should monitor relief operations and reassess Nagaland regional risk for portfolios.
In Mon district, a nagaland landslide has triggered immediate disruptions and raised questions for local businesses and investors alike. With rainfall persisting, authorities warn of flash floods and waterlogging that could slow recovery and affect regional commerce. This guide explains what retail investors should watch in the wake of such events, from relief measures to market risk and resilience strategies.
Nagaland Landslide: Market Implications For Local Stocks And Regional Exposure
The nagaland landslide, confined to Mon district, is unlikely to produce an immediate market-wide crash, but it highlights vulnerabilities in local supply chains and infrastructure-dependent sectors. Mon town bears the brunt, with rescue teams including Assam Rifles, SDRF, Nagaland Police, and local volunteers marshaling to clear debris and establish safe passage. The latest figures show eight people feared dead and four bodies recovered, underscoring the scale of the incident and potential for further casualties as search operations continue. NSDMA head Johnny Ruangmei noted incessant rainfall since early Sunday triggered flash floods and waterlogging, compounding the disruption.
Given the geographic concentration, investors with exposure to Nagaland-related supply chains, transport, or consumer businesses should reassess regional risk. Sectors likely to feel the impact include construction materials suppliers, transport and logistics players, and insurers with regional footprint. Local authorities, including the district administration and DDMA, are coordinating search and relief operations with SDRF and police support. As the situation evolves, the advisory remains: heavy rainfall is expected to persist, and residents should remain vigilant and avoid vulnerable areas.
How Heavy Rainfall And Landslides Affect Insurance And Construction Sector Stocks
In disaster-prone regions, insurance penetration and claims dynamics can shift rapidly after major events. While the Nagaland landslide is geographically contained, the risk profile for insurers operating in the state could tighten, particularly if subsequent rainfall triggers further damage. Construction and infrastructure-related firms could see near-term demand for earthworks and rapid response services, but execution risks rise as resources are diverted to relief and rescue efforts. For retail investors, this translates into a need to watch sector exposure and to consider how insurance and construction plays might behave if the weather pattern continues over the coming days.
Disaster Relief Funding And Government Interventions And Their Market Sentiment Impact
The state government has pledged immediate ex-gratia relief to families of the deceased and relief for those affected. Public statements by the Chief Minister have emphasized close monitoring of the situation and coordination among NSDMA, district admin, DDMA, SDRF, Police, Assam Rifles, and local communities on the ground. In this environment, market sentiment can hinge on updates about rescue progress, relief disbursement, and the scale of damage. For investors with exposure to Nagaland-linked assets or counterparties, monitoring official relief milestones and government communications becomes part of the risk framework.
As authorities reiterate the likelihood of continued rainfall, the continuity of supply chains and the pace of rebuilding will influence stakeholders’ confidence. Investors should track NSDMA updates and district-level responses for signs of stabilization or renewed disruption. For decision-makers, a disciplined approach–grounded in credible updates and gradual adjustment rather than knee-jerk moves–helps prevent overreaction to daily headlines.
Practical Risk Management For Retail Investors In Disaster Prone Regions
Practical steps for individual investors include maintaining liquidity to manage volatility, diversifying across geographies and sectors, and setting rules for rebalancing when localized risks spike. If you hold exposure to Nagaland-linked businesses, consider trimming or hedging with broader market exposure to reduce idiosyncratic risk. Establish monitoring rituals: daily weather briefings, government advisories, and company-level updates, coupled with a ready-to-apply exit or risk-off trigger if conditions deteriorate.
Remember that natural disasters can affect both supply chains and consumer demand. While the nagaland landslide is localized, the ripple effects could impact industries that rely on regional logistics. For deeper insights and stock-specific research, consult Swastika's Sarthi AI stock assistant for institutional-grade research on any stock or index to retail investors.
Monitoring Weather Trends And Corporate Supply Chain Risks For Portfolio Resilience
Disaster-prone regions require a forward-looking risk lens. In Nagaland, continuous rainfall, possible landslides, and waterlogging create uncertainty around roads, feeder routes, and local businesses. Investors should integrate weather outlooks, NSDMA briefings, and district-level advisories into their portfolio risk dashboards. The event demonstrates that even small regions can trigger localized volatility if supply chains are concentrated and infrastructure is fragile. Diversification and ongoing risk assessment are essential to resilience.
Frequently Asked Questions
What caused the Nagaland landslide and which area was affected?
The event was triggered by heavy rainfall leading to landslides and flash floods; It affected Mon district, including Mon town and areas like Tuli subdivision and Mokokchung.
How many casualties were reported?
Initial reports said four dead with four more feared trapped; later updates indicated eight feared dead and four bodies recovered.
Who is coordinating the rescue and relief operations?
Rescue operations involve Assam Rifles, SDRF, Nagaland Police, local volunteers, and district authorities under NSDMA leadership led by Johnny Ruangmei.
What relief measures were announced?
The government announced immediate ex-gratia relief to families of the deceased and relief to residents. The Chief Minister and Deputy Chief Minister expressed condolences and oversight.
What should investors watch after such events?
Investors should monitor official updates from NSDMA and district authorities, watch for weather advisories, assess regional exposure to Nagaland-linked supply chains, and consider risk-based portfolio adjustments.
Conclusion
The nagaland landslide in Mon district highlights how regional events can test risk management discipline for retail investors. While the immediate impact is concentrated, the incident underscores the importance of monitoring official relief progress, weather patterns, and supply-chain vulnerabilities that could affect local businesses and related securities. Build a playbook: stay informed, diversify, and apply a measured approach to regional risk rather than chasing headlines.
For deeper due diligence, consider Swastika's Sarthi AI stock assistant to access institutional-grade research on any stock or index. This tool helps retail investors translate dynamic regional events into actionable investment insights and portfolio adjustments.
Open your trading and demat account here
Reference :
1 : Ndtvprofit
Nifty Share Price Outlook: Key Levels, Bank Nifty Action, Q1 Earnings Momentum
Key Takeaways
- nifty share price faces resistance around 24,500–24,550 as earnings roll in.
- Support sits around 24,150–24,200, offering a buffer for pullbacks.
- bank nifty stock shows resistance around 58,700–58,800 with possible targets to 59,200 and 59,600 on a breakout.
- Retail investors can use Swastika's Sarthi AI stock assistant for deeper stock research.
Can a 261.55-point surge in the nifty share price change the near-term trajectory? Nifty closed Friday at 24,334.30, up 1.09% (261.55 points), as the first wave of Q1FY27 earnings rolls in. The weekly picture shows Nifty 50 and Sensex gaining about 0.6% for the week, signaling a cautious but improving risk appetite as earnings season gathers pace. For retail investors, the question is how to navigate the 24,500–24,550 resistance while watching for clues on the next breakout signal in the nifty share price.
Nifty Share Price Technical Levels To Watch As Q1 Earnings Roll In
The immediate resistance for Nifty share price is placed in the 24,500–24,550 zone, aligning with the previous swing high. If this resistance is broken, the pullback could extend toward 24,700, as highlighted by an SBI Securities analyst in the context of the chart. The immediate support sits at 24,200–24,150, offering a cushion against a deeper pullback in volatile sessions. Friday's close of 24,334.30 and the 1.09% daily gain underscores the potential for a test of the resistance zone in the coming sessions.
According to Sudeep Shah of SBI Securities, If Nifty breaks through the resistance levels the pullback can extend towards 24,700.
Reference :
1 : Ndtvprofit
Beyond the day-to-day moves, investors should keep a close eye on the earnings cadence. The Q1FY27 earnings season is shaping the market's tone, and the direction of large-cap leadership often sets the rhythm for sectoral winners. A breakout in the nifty breakout scenario would further embolden risk-taking, while caution near the 24,200 level can keep downside risk in check.
Key Support And Resistance For The Nifty Share Price In July 2026
From a levels perspective, the Nifty share price's immediate resistance sits at 24,500–24,550, in line with the previous swing high. The immediate support is placed around 24,200–24,150. If the index breaks above 24,550 decisively, 24,700 becomes a near-term target. Conversely, a break below 24,150 could invite a test of the 24,000 level or lower. The setup also implies that tracking the Bank Nifty stock path will provide early directional cues for the broader market and help fine-tune risk controls.
| Index | Key Levels | Notes |
|---|---|---|
| Nifty | Support 24,150–24,200; Resistance 24,500–24,550 | Near-term thresholds to watch |
| Bank Nifty | Support 58,100–58,000; Resistance 58,700–58,800 | Short-term directional cues |
Bank Nifty Stock Action And Its Implications For Retail Investors
The Bank Nifty stock path remains a crucial barometer for the broader market. The immediate resistance for Bank Nifty is placed in the 58,700–58,800 zone, which coincides with its previous swing high. Any sustainable move above this zone could extend toward 59,200, followed by 59,600 in the short term. On the downside, the immediate support sits near 58,100–58,000. The Bank Nifty opened on a positive note and extended its rally, supported by strong buying in banking heavyweights, which suggests the market may maintain an upbeat tilt if earnings from the sector stay supportive.
HDFC Bank Stock Price And Punjab National Bank Stock Price Context In Q1
On Saturday, heavyweights like hdfc bank stock price, punjab national bank stock price, icici bank stock, and kotak mahindra bank stock price posted their quarterly numbers, which will help set the equity arena on Monday. This cluster of big-name financials often drives the market’s sentiment and provides a focal point for risk management in the near term. Investors should focus on fundamentals and price action in these names to gauge the health of the financials part of the index, as well as its effect on the nifty share price.
Nifty And Bank Nifty: Market Momentum And The Earnings Lens
With earnings season shaping the narrative, the market’s momentum these days reflects a blend of price action and fundamental prints. The weekly stats show Nifty 50 and Sensex up about 0.6% for the week, while Friday delivered a 1.09% rise for Nifty to 24,334.30 and a 1.25% rise for Sensex to 78,151.45. The combination of a rising tide in major indices and resilient earnings supports a constructive stance, particularly for the banking and financial services space. Traders should monitor the pace of guidance and the breadth of gains across sectors to time risk accordingly.
According to Siddhartha Khemka of Motilal Oswal Financial Services, Indian equities are expected to witness a gradual uptrend next week, on the back of a strong Q1FY27 earnings season so far, which is likely to remain the key driver of sectoral and stock-specific performance.
As this narrative unfolds, the price action in major banks such as hdfc bank stock price, punjab national bank stock price, icici bank stock, and kotak mahindra bank stock price will continue to influence the direction. The Nifty share price's behavior around these names will likely shape the market’s trajectory in the near term, reinforcing the importance of disciplined risk management and price-based entries for retail traders.
Related Reads
- Nifty Share Price Outlook: Break Above 24,500 Could Spark Stock-Specific Bets
- Nifty Share Price Steady Start As Global Cues Turn Weak: Swastika Investmart Market Analysis
- Nifty Share Price Insights: GIFT Signals Flat And Oil Rises
Frequently Asked Questions
What is the immediate resistance level for the Nifty share price?
The immediate resistance is around the 24,500–24,550 zone.
What is the immediate support for the Nifty share price?
The immediate support is around the 24,200–24,150 zone.
What could happen if Nifty breaks through resistance?
If Nifty breaks through the resistance levels, the pullback can extend towards 24,700.
What are the Bank Nifty stock levels to watch?
Immediate resistance around 58,700–58,800; potential extension to 59,200 and 59,600 if the move sustains above that zone; support is near 58,100–58,000.
Which major banks reported Q1 results and impacted the market?
HDFC Bank stock price, Punjab National Bank stock price, ICICI Bank stock, and Kotak Mahindra Bank stock price posted quarterly numbers.
What does the earnings momentum imply for the market?
Strong Q1FY27 earnings season is likely to remain the key driver of sectoral and stock-specific performance, supporting a gradual uptrend.
Conclusion
The near-term horizon for the nifty share price looks like a cautious balance between resistance at 24,500–24,550 and support near 24,150–24,200. A decisive break above 24,550 can pave the way for a test of 24,700, while a breach below 24,150 would invite further downside toward the 24,000s. Bank Nifty’s structure reinforces this view, with 58,700–58,800 acting as a cap and the potential for 59,200 and 59,600 if the trend remains constructive. Earnings momentum from big lenders like hdfc bank stock price, punjab national bank stock price, icici bank stock, and kotak mahindra bank stock price continues to shape sector leadership and the nifty share price’s direction. For retail investors, the prudent approach is to focus on risk controls, validate price action with earnings flow, and consider a research tool such as Swastika's Sarthi AI stock assistant to tailor an evidence-based trading plan.
As you plan your next steps, keep a disciplined framework that centers on price levels, earnings catalysts, and sector leadership. Use pullbacks near 24,150–24,200 as potential entry points with strict stop placements, and await a confirmed breakout above 24,550 before committing larger exposures. In this environment, the risk-reward equation favors patient, data-driven decisions rather than impulsive bets, especially as earnings season continues to unfold for the nifty share price and bank-led segments.
Anarock Dubai Real Estate: Dubai Housing Market Signals In 2026
Key Takeaways
- Anarock Dubai Real Estate signals Dh225.7B in H1 2026 transactions.
- Prices rose 6% to about Dh1,900 per sq ft.
- Off-plan shares rose to 70-77% with 80% cash buyers.
- Indians, British and Chinese buyers accounted for 22%, 17%, and 14% respectively in 2025.
In Anarock Dubai Real Estate's latest market snapshot for 2026, Indians and Brits continue to drive activity even as regional tensions linger. In the first half of 2026, residential transactions reached Dh225.7 billion (Rs 5.91 lakh crore), with prices rising about 6% and average prices around Dh1,900 per sq ft, up from Dh1,800 in the prior year. More than 150 countries invested in Dubai's residential market in 2025, with Indians accounting for 22%, British 17%, and Chinese 14% of the market.
Anarock Dubai Real Estate H1 2026 Transactions And Price Trend Overview
Dubai's 1H 2026 performance shows a resilient market with a 6% price rise and an average price around Dh1,900 per sq ft. The Dh225.7 billion in transactions in H1 2026 marks a strong intake of demand, reflecting healthy underlying fundamentals even as sentiment fluctuated due to regional tensions.
According to Aayush Puri of Anarock, While geopolitical tensions briefly affected buyer sentiment during March and April 2026, the correction was largely sentiment-driven–not structural; Residential prices softened by just 4-7 per cent in the February to April period, significantly outperforming the Dubai Financial Market Real Estate stock index, which crashed 34 per cent at its peak,
Reference :
1 : Ndtvprofit
As of 1H 2026, off-plan properties accounted for 70-77% of residential transactions, underscoring sustained buyer confidence in the launch pipeline despite near-term uncertainties. The market's rebound is anchored by strong demand from a diverse base of buyers and a steady pipeline of supply.
Population growth in Dubai accelerated in 2025, with around 470 residents added each day, pushing the emirate's population beyond 4.03 million. The growth translated into a broader investor base, with the number of new investors in Dubai's real estate market up 23% YoY to more than 129,600 in 2025.
Cash purchases dominated the market, representing about 80% of transactions. Among buyers, 38% purchased homes for personal use, 28% invested to generate rental income, 21% bought to qualify for the UAE's Golden Visa programme, while 13% cited wealth preservation as their primary motivation.
Investors should note that Anarock expects Dubai's residential prices to rise 4-7% in 2026, buoyed by government initiatives, sustained overseas demand, and continued population growth. However, a renewed escalation in regional conflict remains the biggest downside risk for the market in the second half of the year.
For retail investors seeking deeper market and stock research, Swastika's Sarthi AI stock assistant can help synthesize this data with company-specific metrics: Swastika's Sarthi AI stock assistant.
Indians British And Chinese Buyer Share In Dubai Real Estate Trends 2025
The 2025 Dubai residential market saw Indians accounting for 22% of the buyer base, British buyers at 17%, and Chinese investors at 14%. Buyers from more than 150 countries invested in Dubai's residential market in 2025, reflecting a broad-based global demand. The mix indicates a continued preference for international capital in a market with rising population and expanding urban density.
Off-Plan Share And Cash Buyer Trends In Dubai Market
Off-plan properties represented a dominant share of residential transactions in the cited period, accounting for 70-77%. Cash purchases accounted for about 80% of transactions, signaling strong liquidity among global buyers despite short-term sentiment shifts.
Dubai Population Growth And Investor Activity In 2025
Dubai's population grew by roughly 470 residents per day during 2025, lifting the total above 4.03 million. The 23% YoY increase in new investors to more than 129,600 in 2025 underscores the market's attractiveness for long-term ownership and rental yield opportunities.
Future Price Trajectory And Market Outlook For 2026
Analysts expect Dubai's residential prices to rise 4-7% in 2026, buoyed by government initiatives, sustained overseas demand, and continued population growth. The biggest downside risk remains a renewed escalation in regional conflict, which could temper sentiment and slow activity if global tensions intensify.
Frequently Asked Questions
What was the value of Dubai residential transactions in the first half of 2026?
Dh225.7 billion (Rs 5.91 lakh crore).
What was the average price per square foot in Dubai during the first half of 2026?
About Dh1,900 per sq ft, up 6% from Dh1,800 in the prior year.
What were the nationalities' shares of Dubai's residential market in 2025?
Indians 22%, British 17%, and Chinese 14%.
What portion of Dubai's residential transactions were off-plan in the period?
70-77%.
What percentage of transactions were cash purchases in the period?
About 80%.
What is the 2026 price outlook for Dubai real estate according to Anarock?
Dubai residential prices are expected to rise 4-7% in 2026.
Conclusion
For the retail investor, the Dubai real estate narrative in 2026 is about balance: resilient price momentum, a heavy tilt toward off-plan launches, and a diversified investor base underpinning demand. The key mental model is to map risk against liquidity: prioritize assets with visible cash flows, a robust pipeline, and clear regulatory support, while staying vigilant for geopolitical shifts that could alter sentiment.
Big Budget


Popular Articles
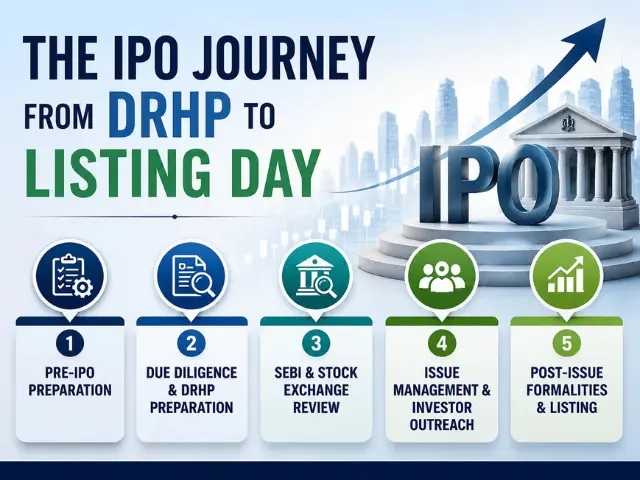


.avif)
.avif)

.avif)


START YOUR INVESTMENT JOURNEY
Get personalized advice from our experts
- Dedicated RM Support
- Smooth and Fast Trading App
